ARIZONA
Arizona, the sixth-largest U.S. state, encompasses diverse climates and topography. The deserts in the south are some of the hottest and driest areas of the country, while the higher terrain of the Colorado Plateau in the northeast has a cooler climate, with cold winters and mild summers. The mountain ranges that run from the northwest to the southeast experience heavier precipitation and wide temperature variations. Annual average (1991–2020 normals) temperatures range from the 40s (°F) at the highest elevations in the mountains to the mid-70s (°F) in the lower elevations of the south. The southern deserts frequently experience summer temperatures between 105°F and 115°F. Phoenix has the hottest climate of all major U.S. cities. Extreme temperatures in Arizona range from a record high of 128°F at Lake Havasu City (June 29, 1994) to a record low of −40°F at Hawley Lake (January 7, 1971). The hottest year on record was 2017, with a statewide annual average temperature of 63.0°F, which is 3.3°F above the long-term (1895–2020) average.
Figure 1
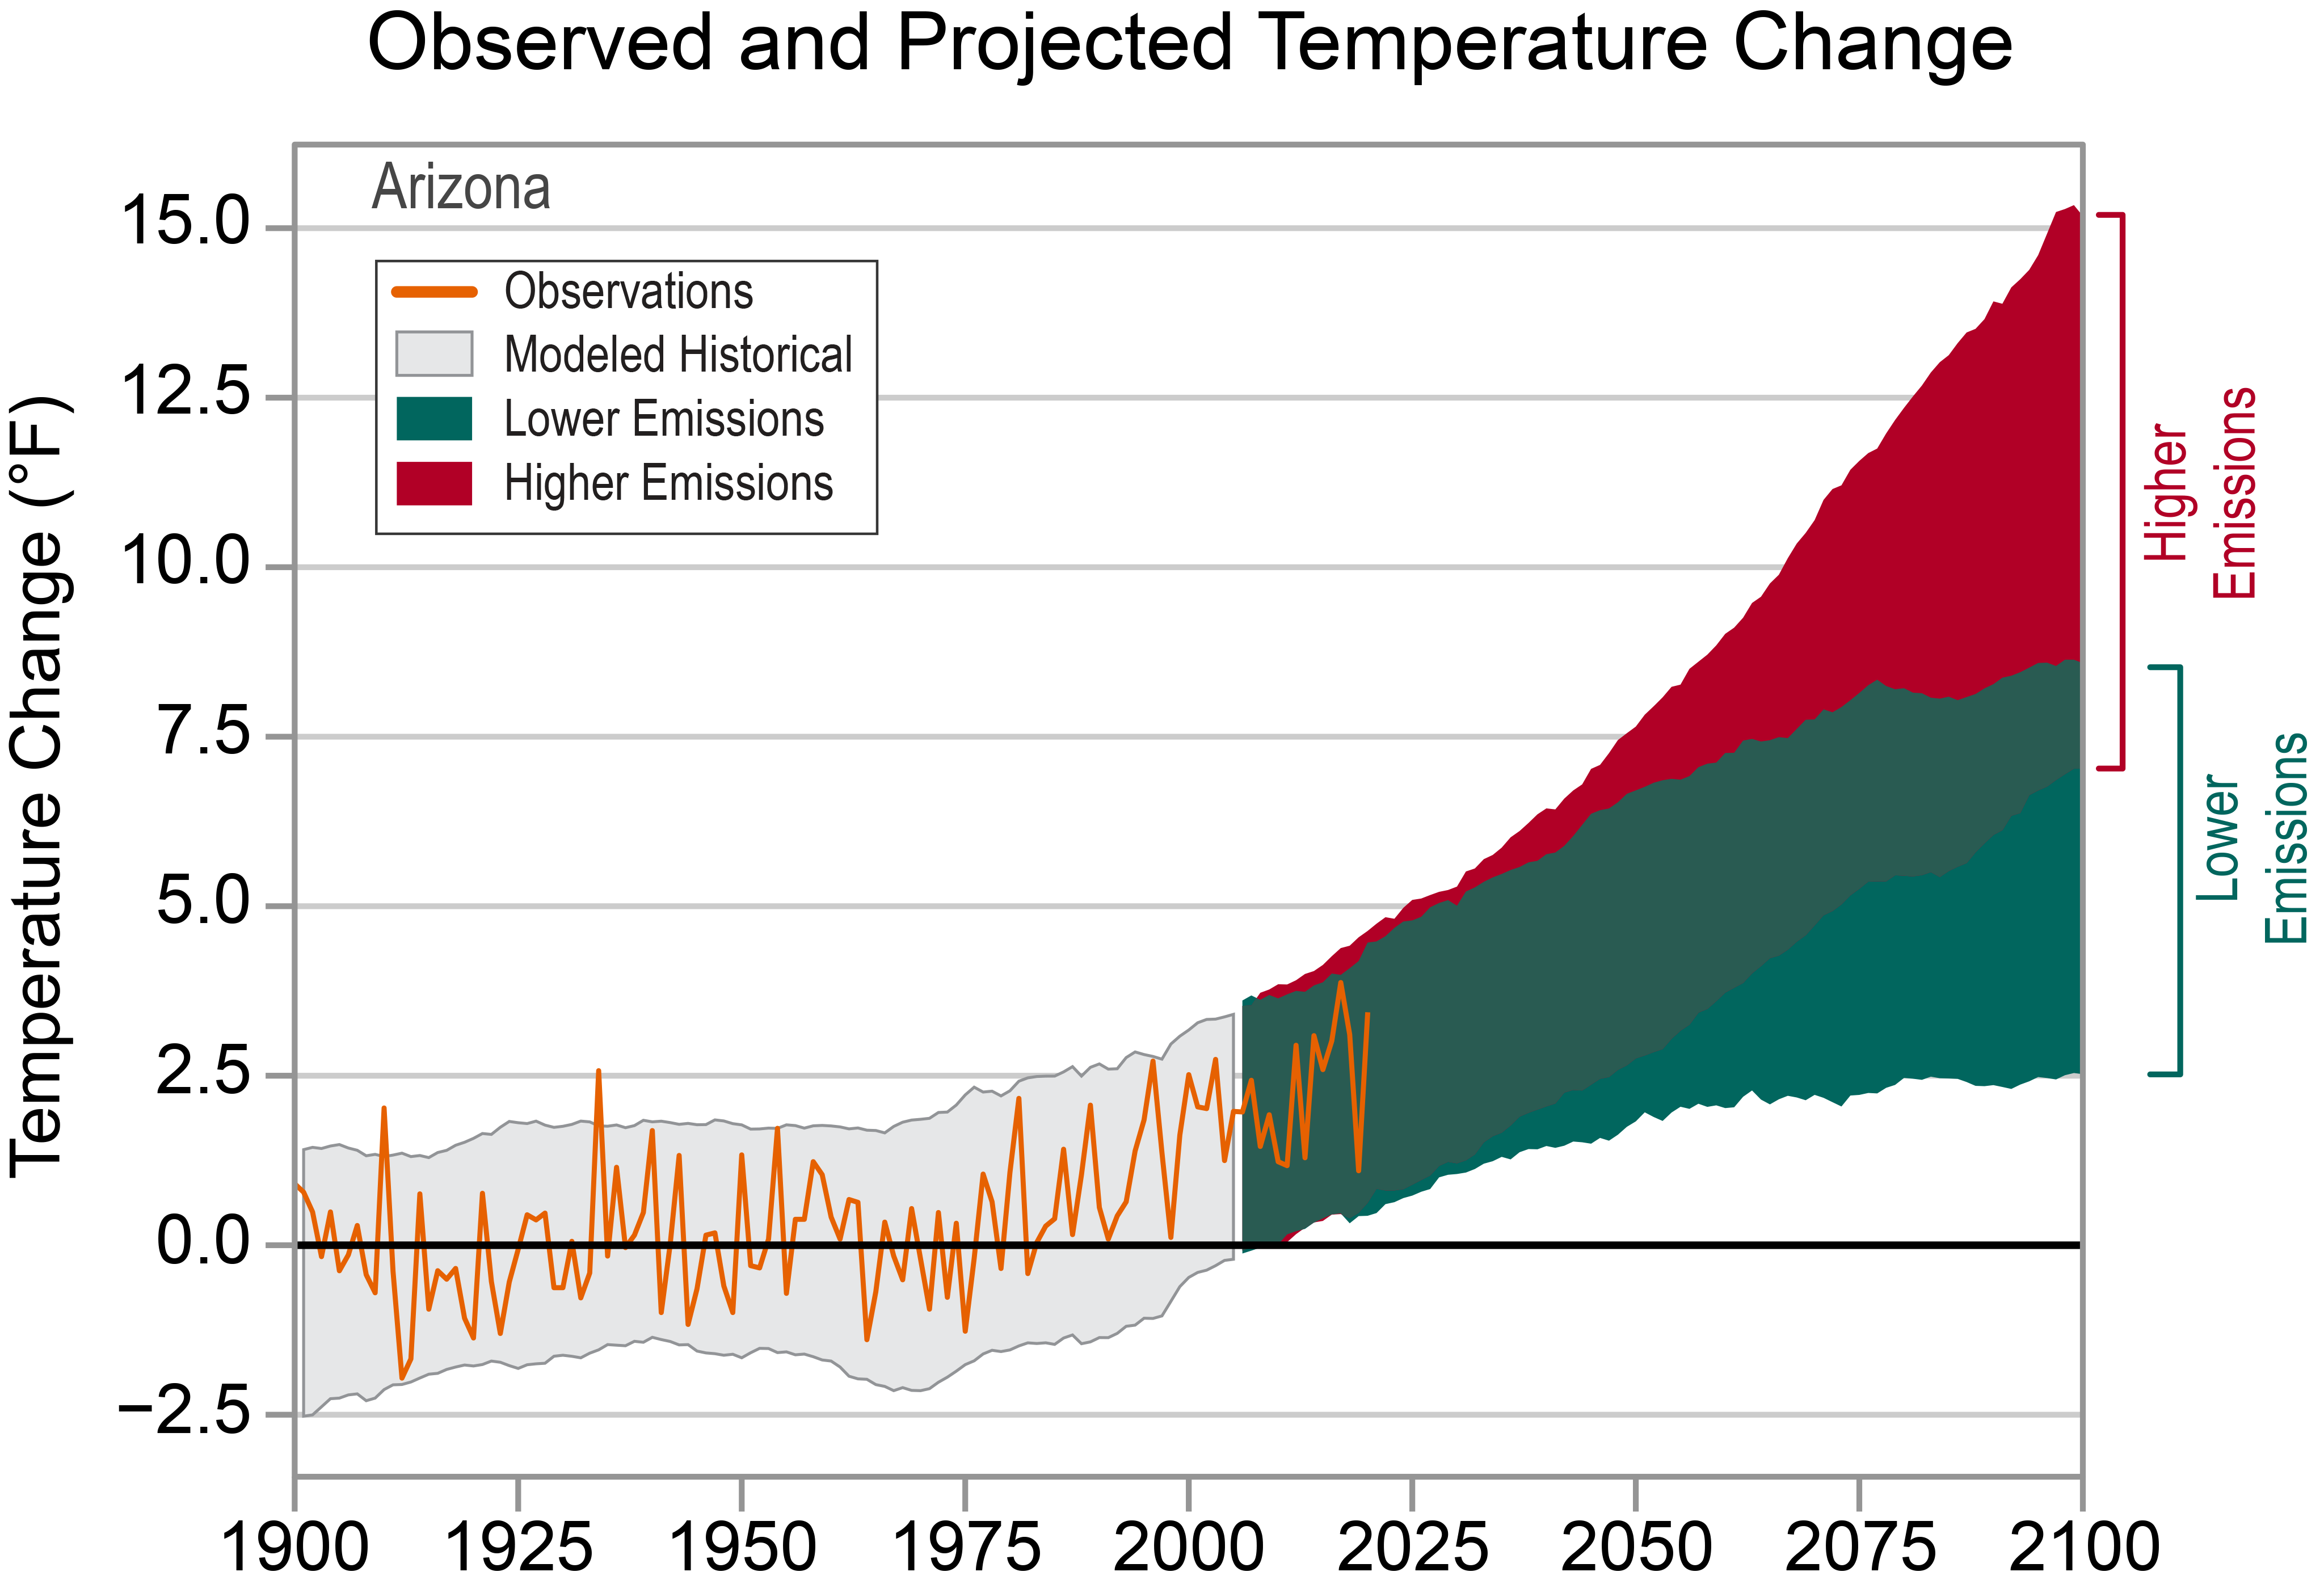
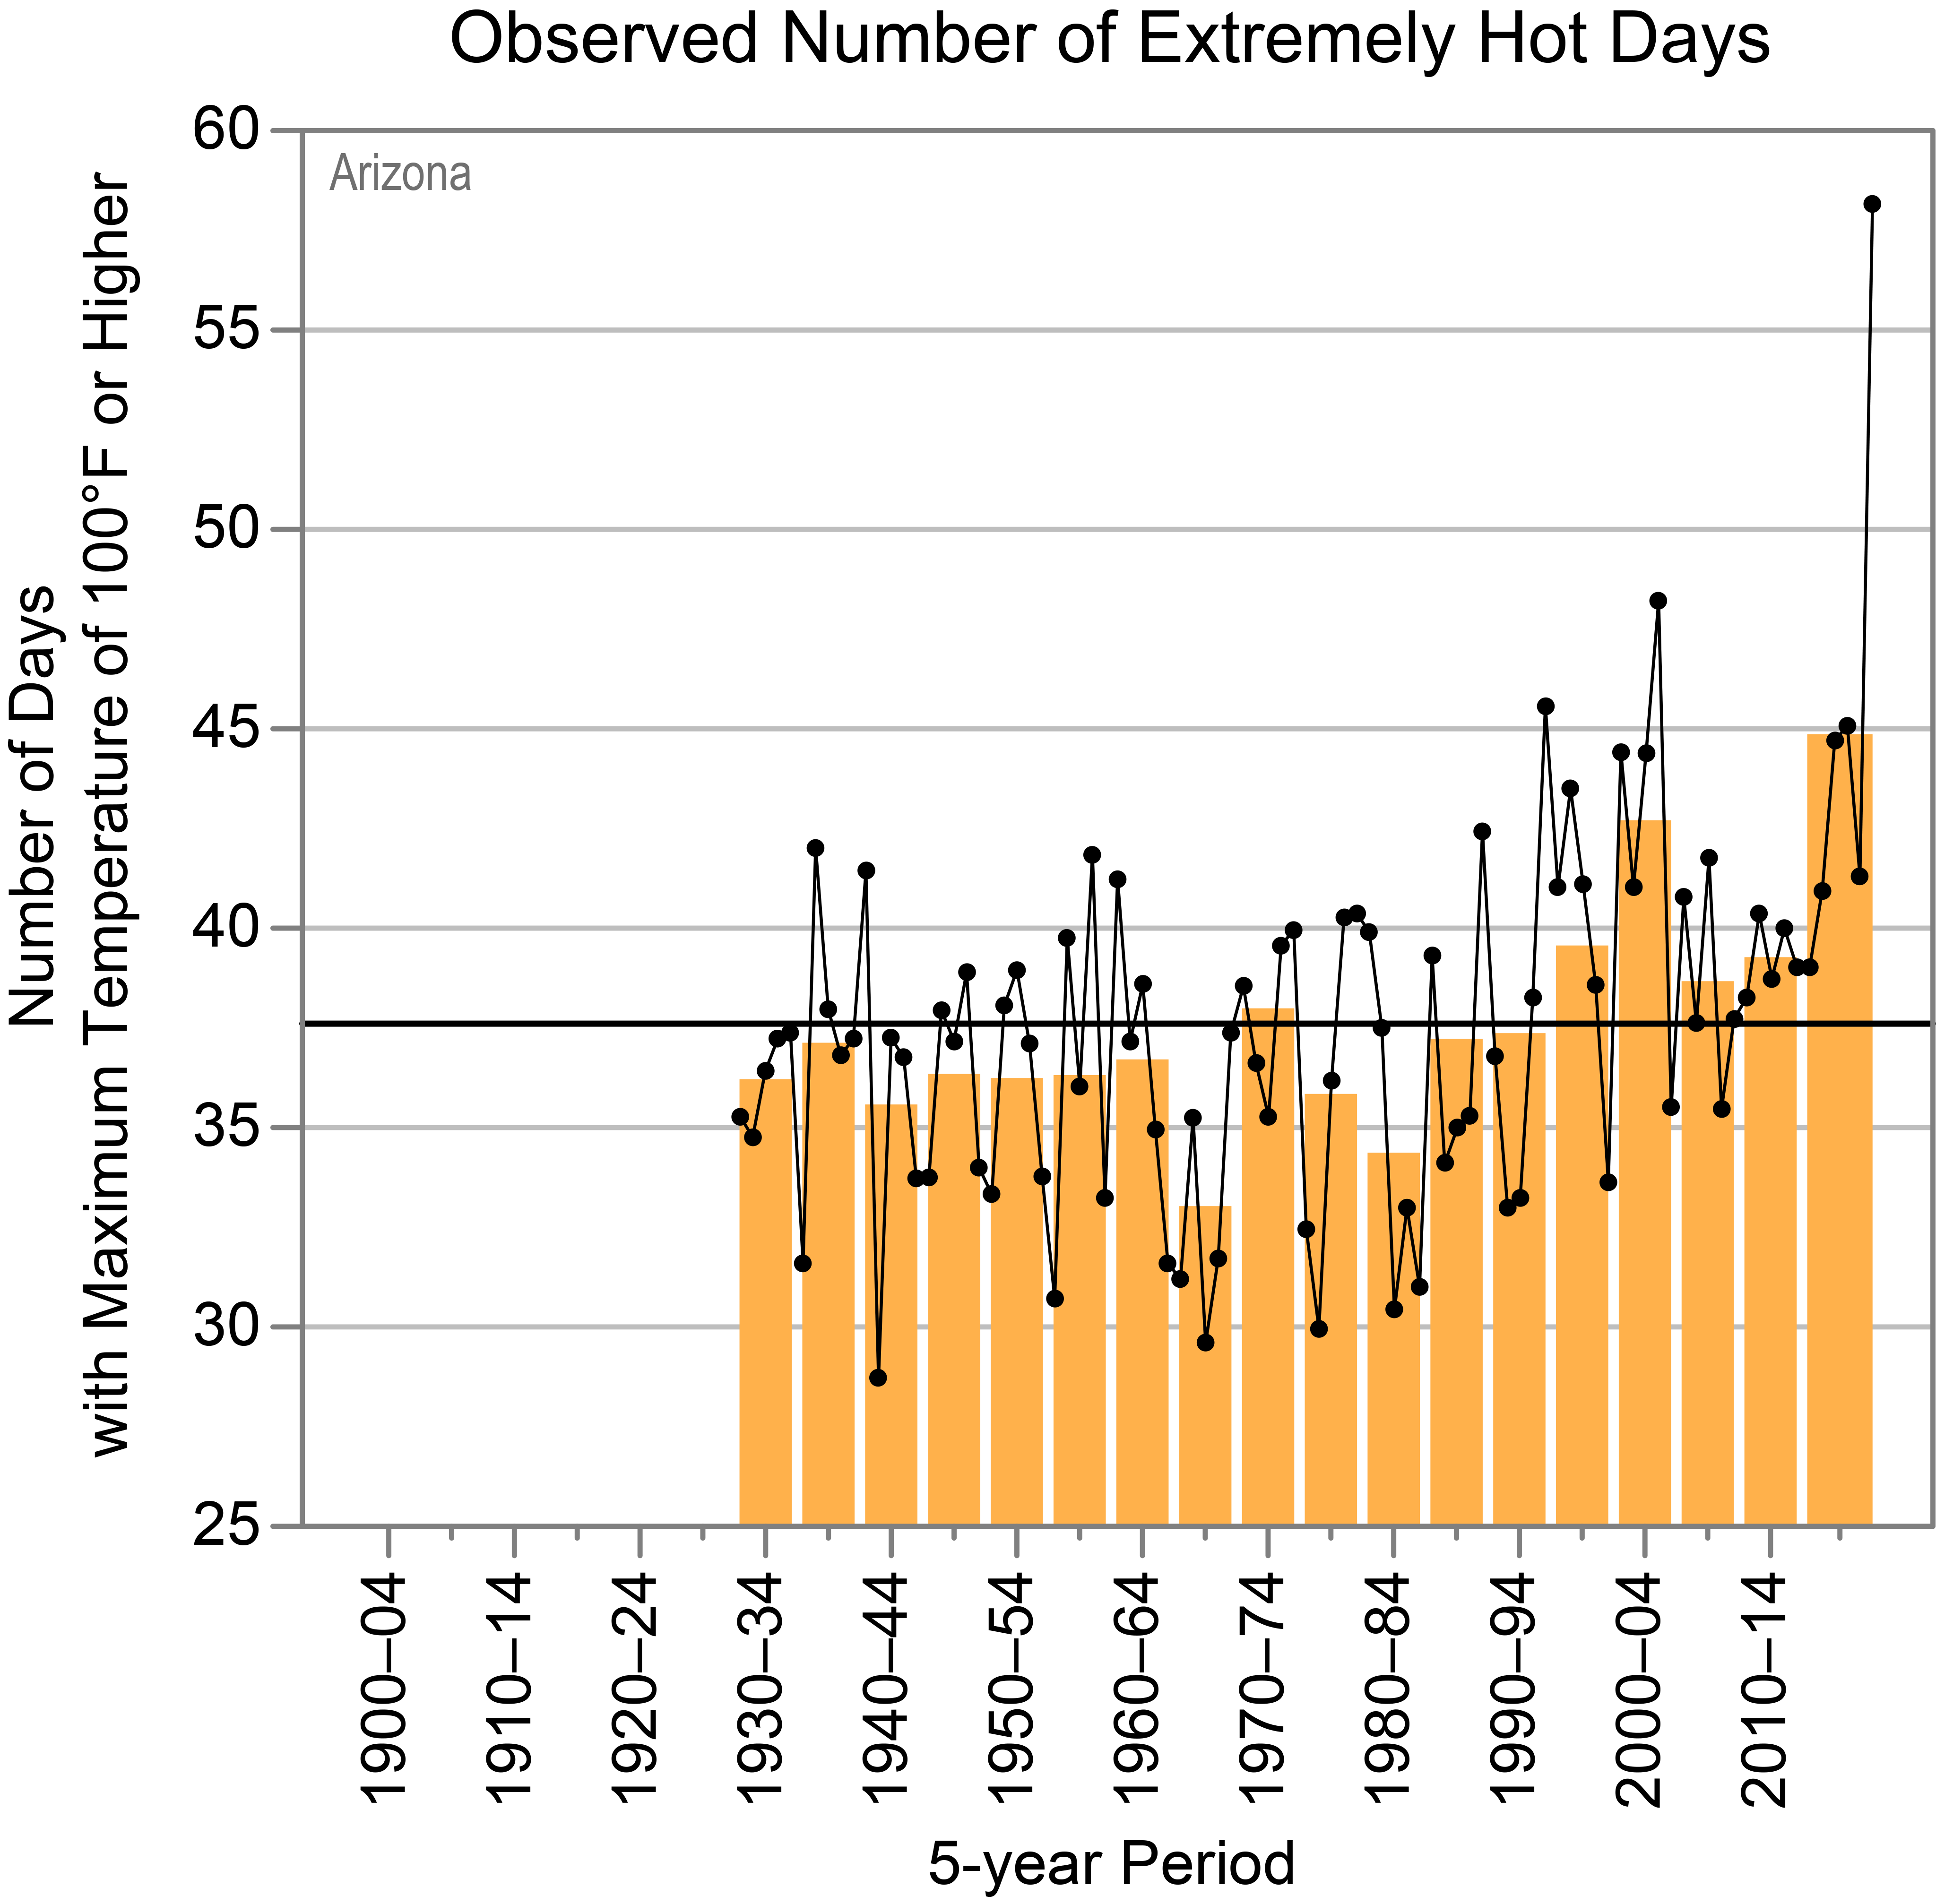
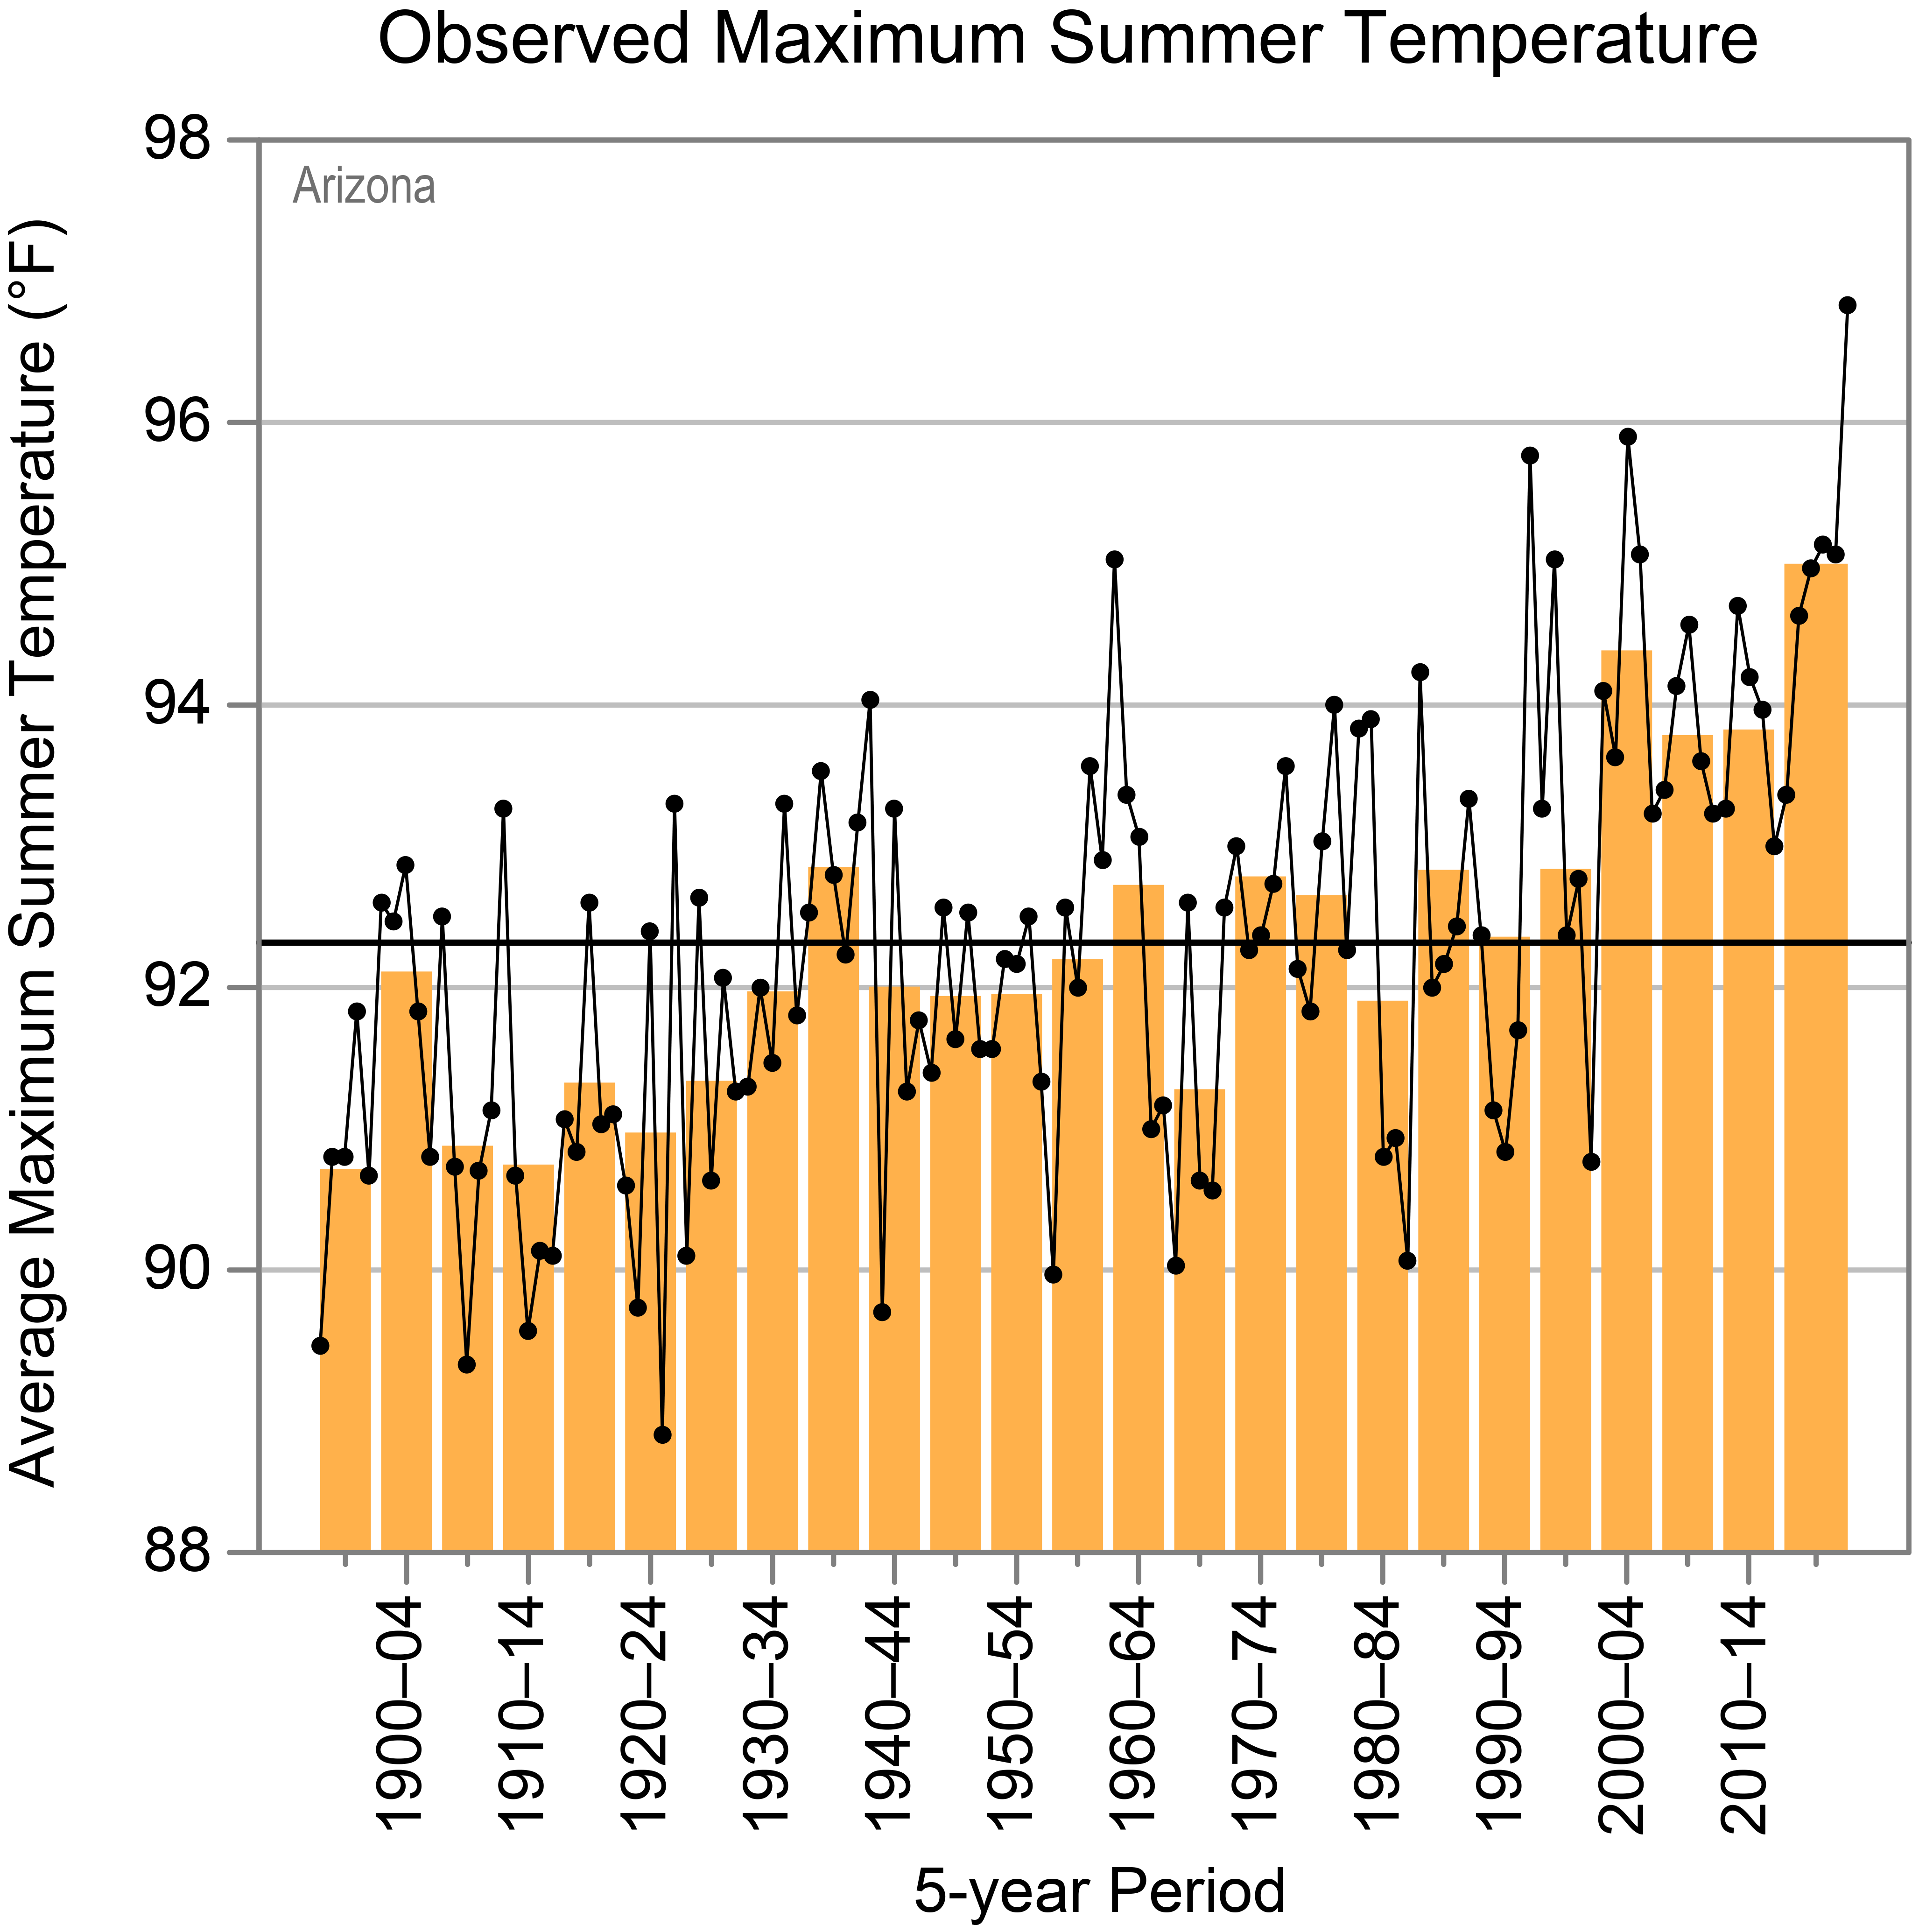
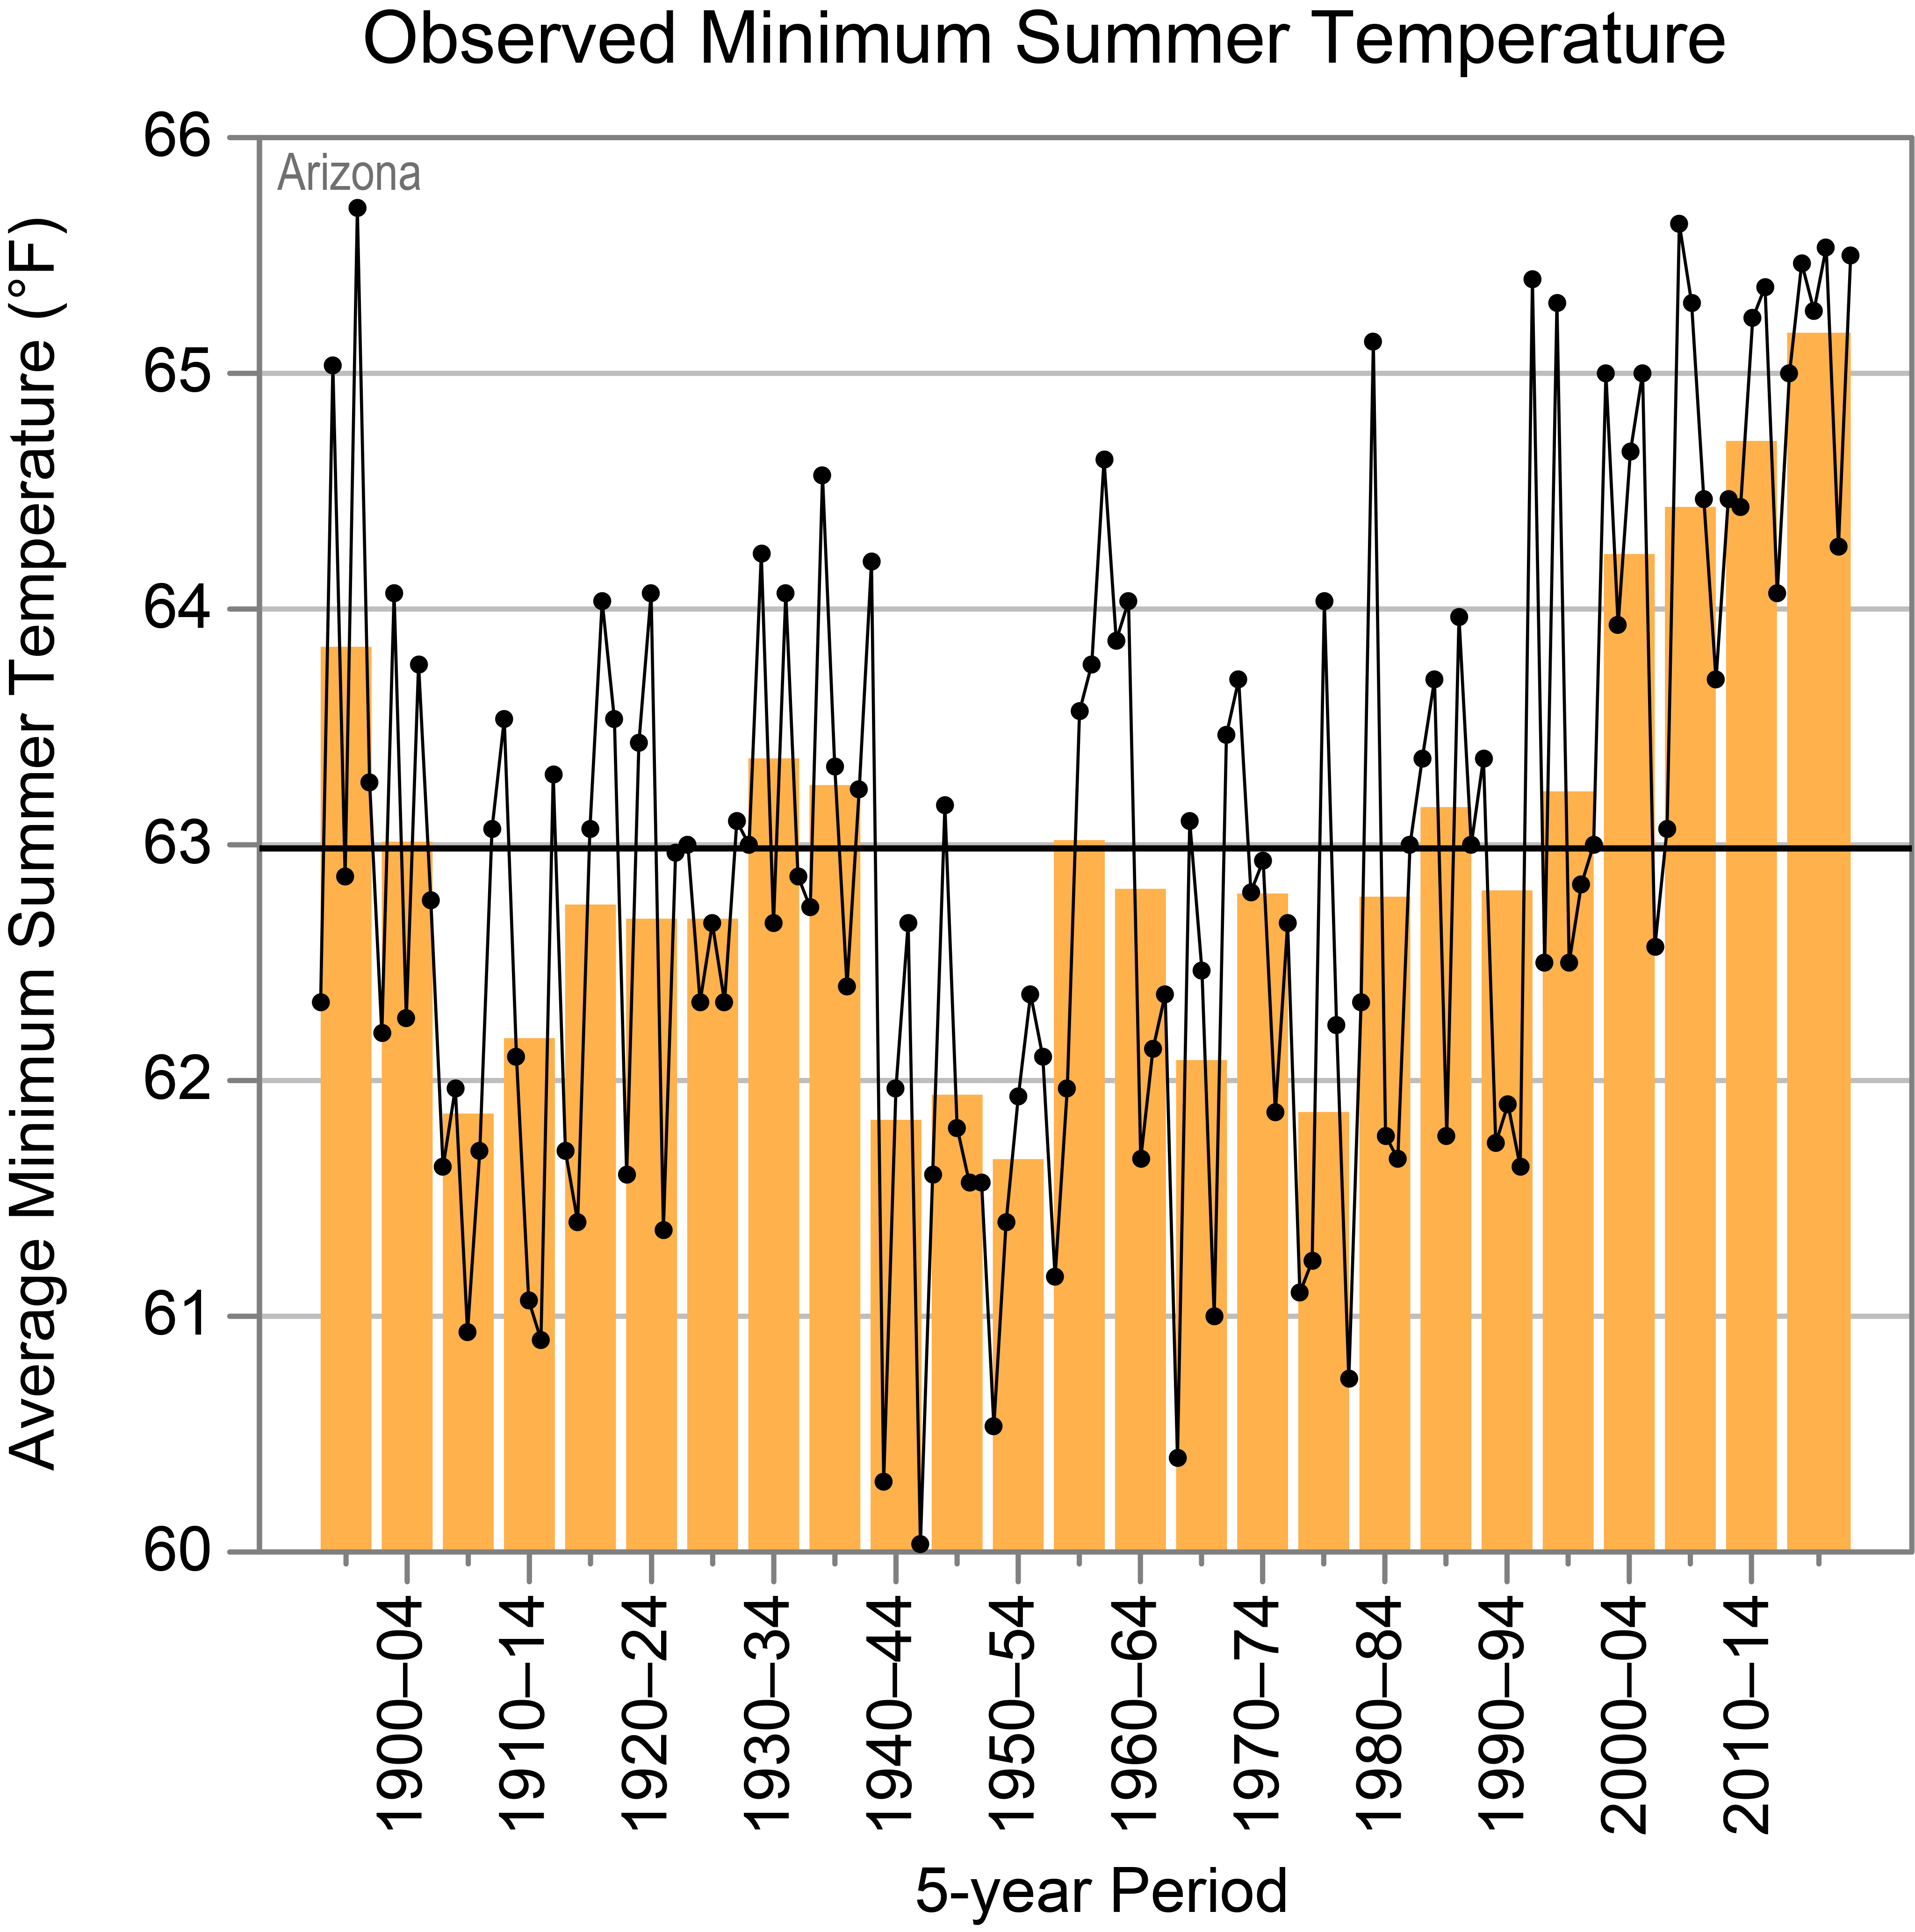
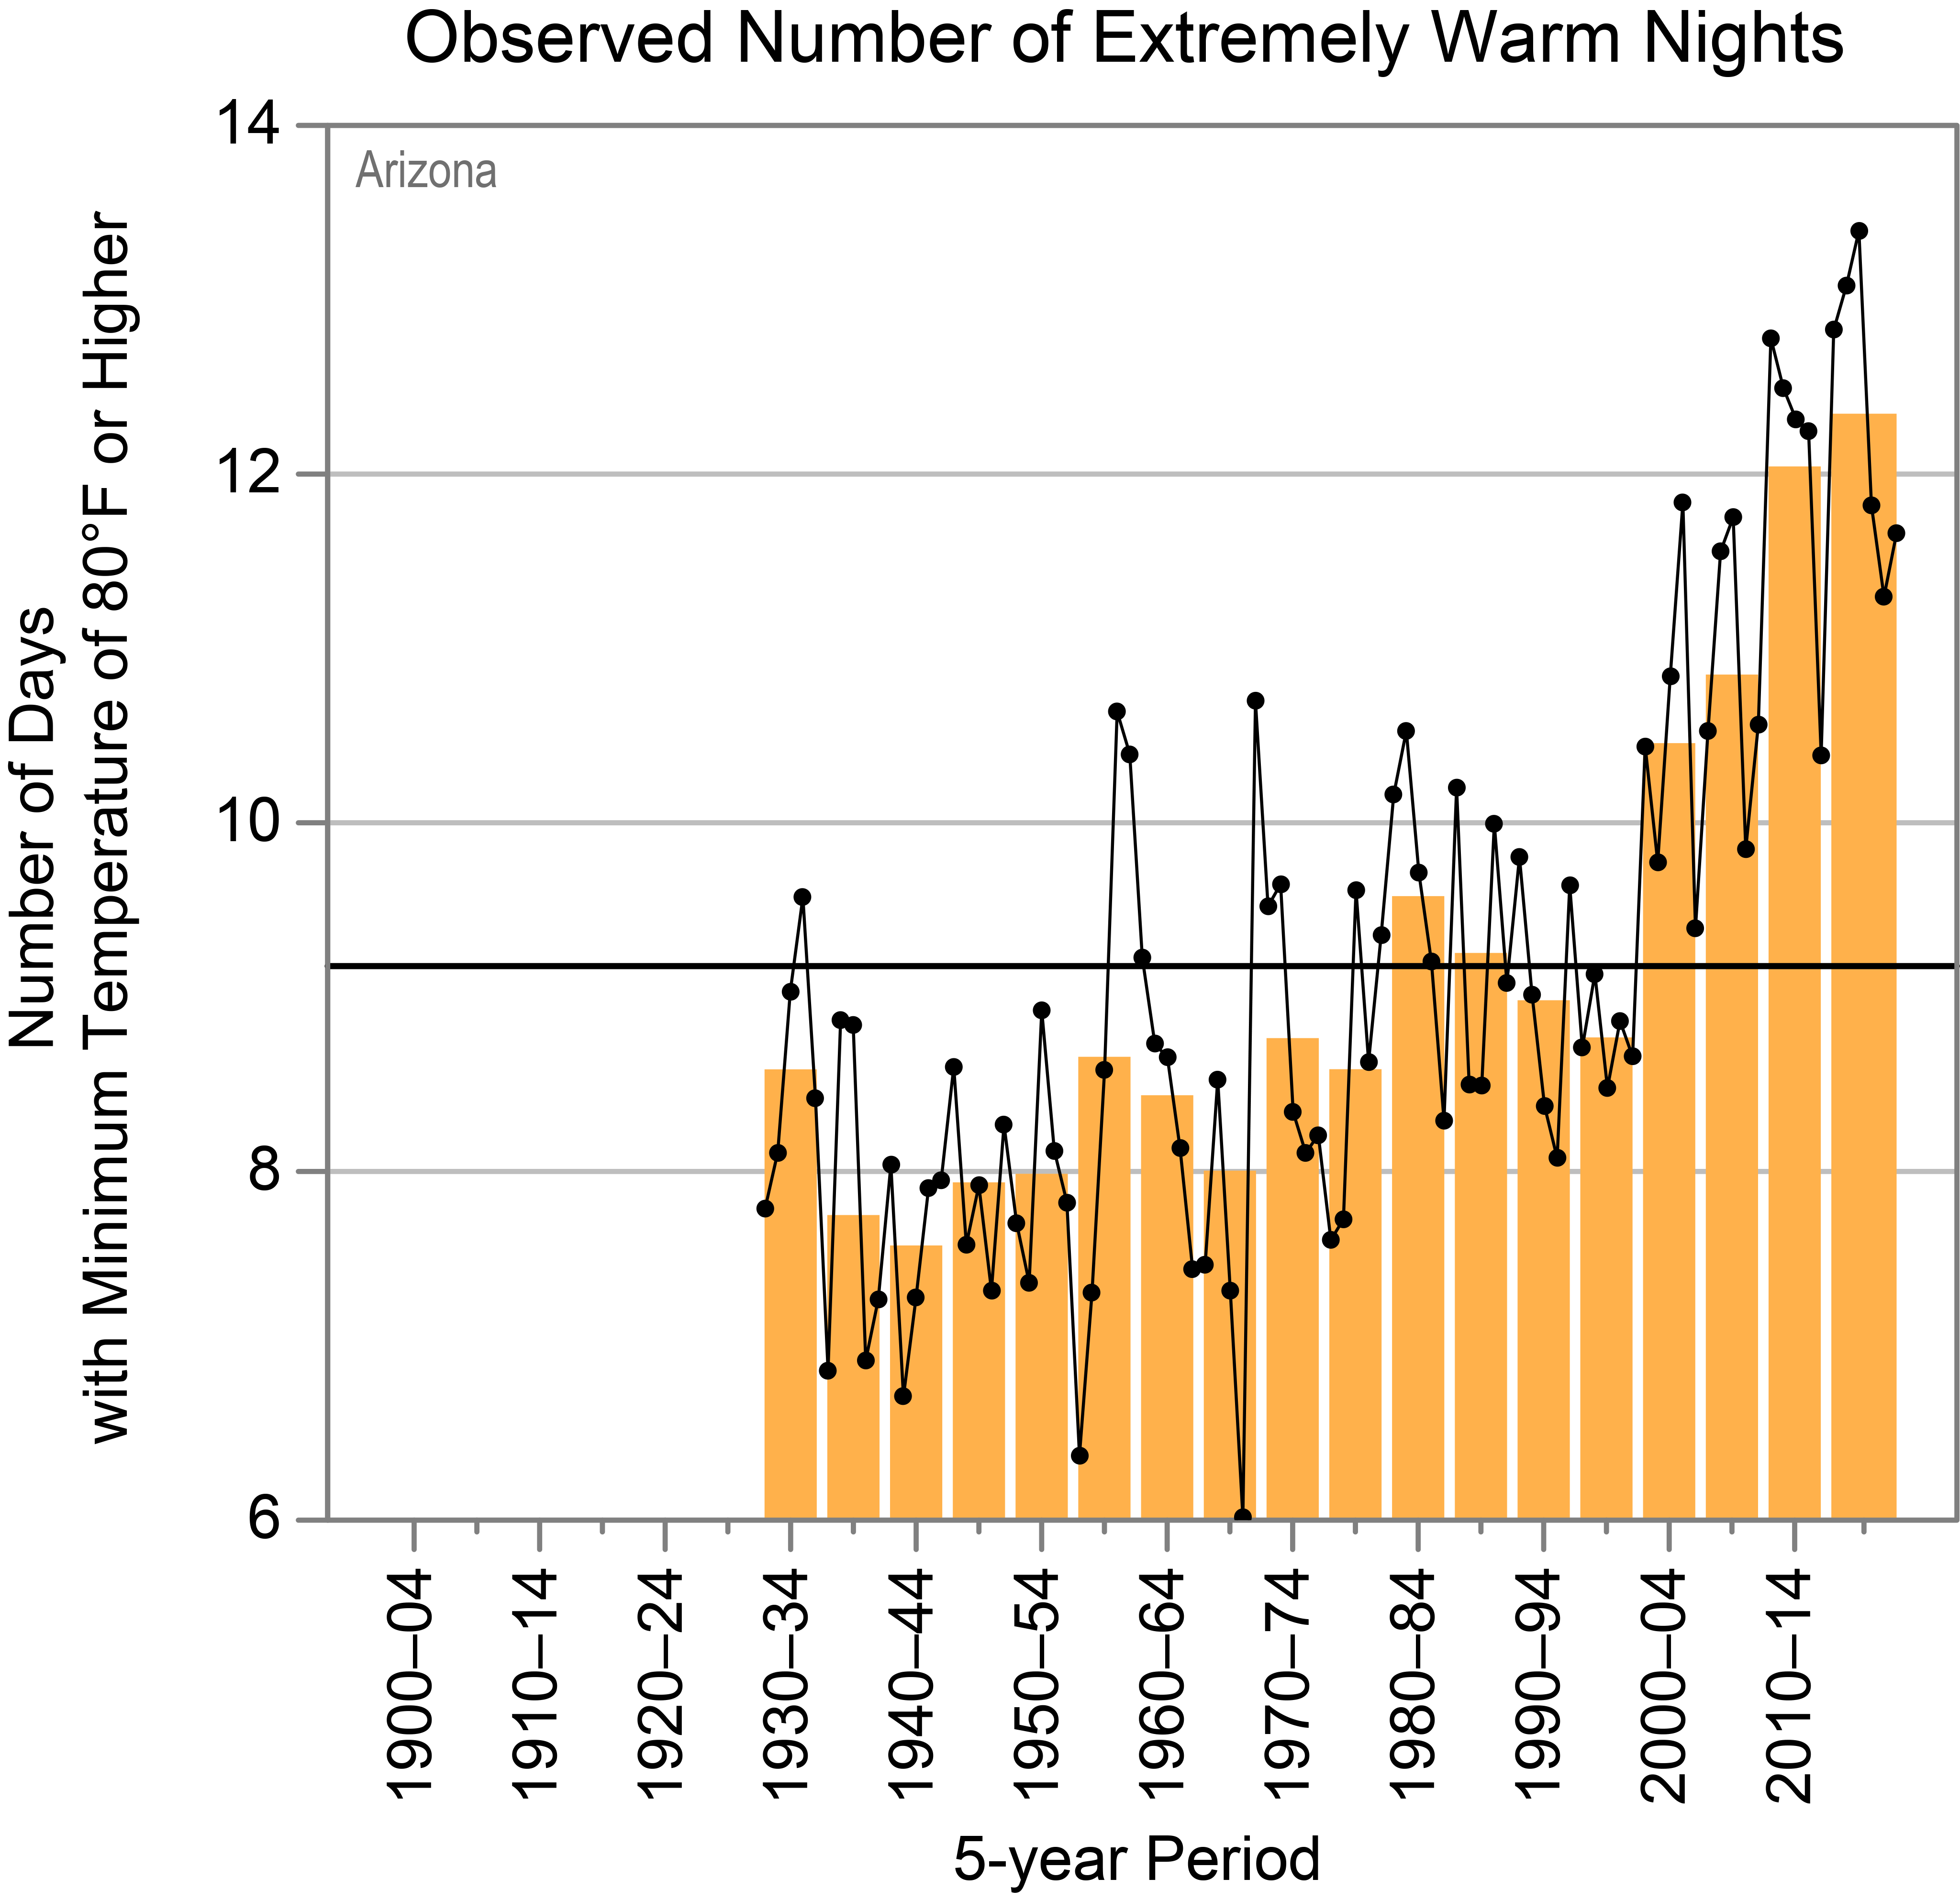
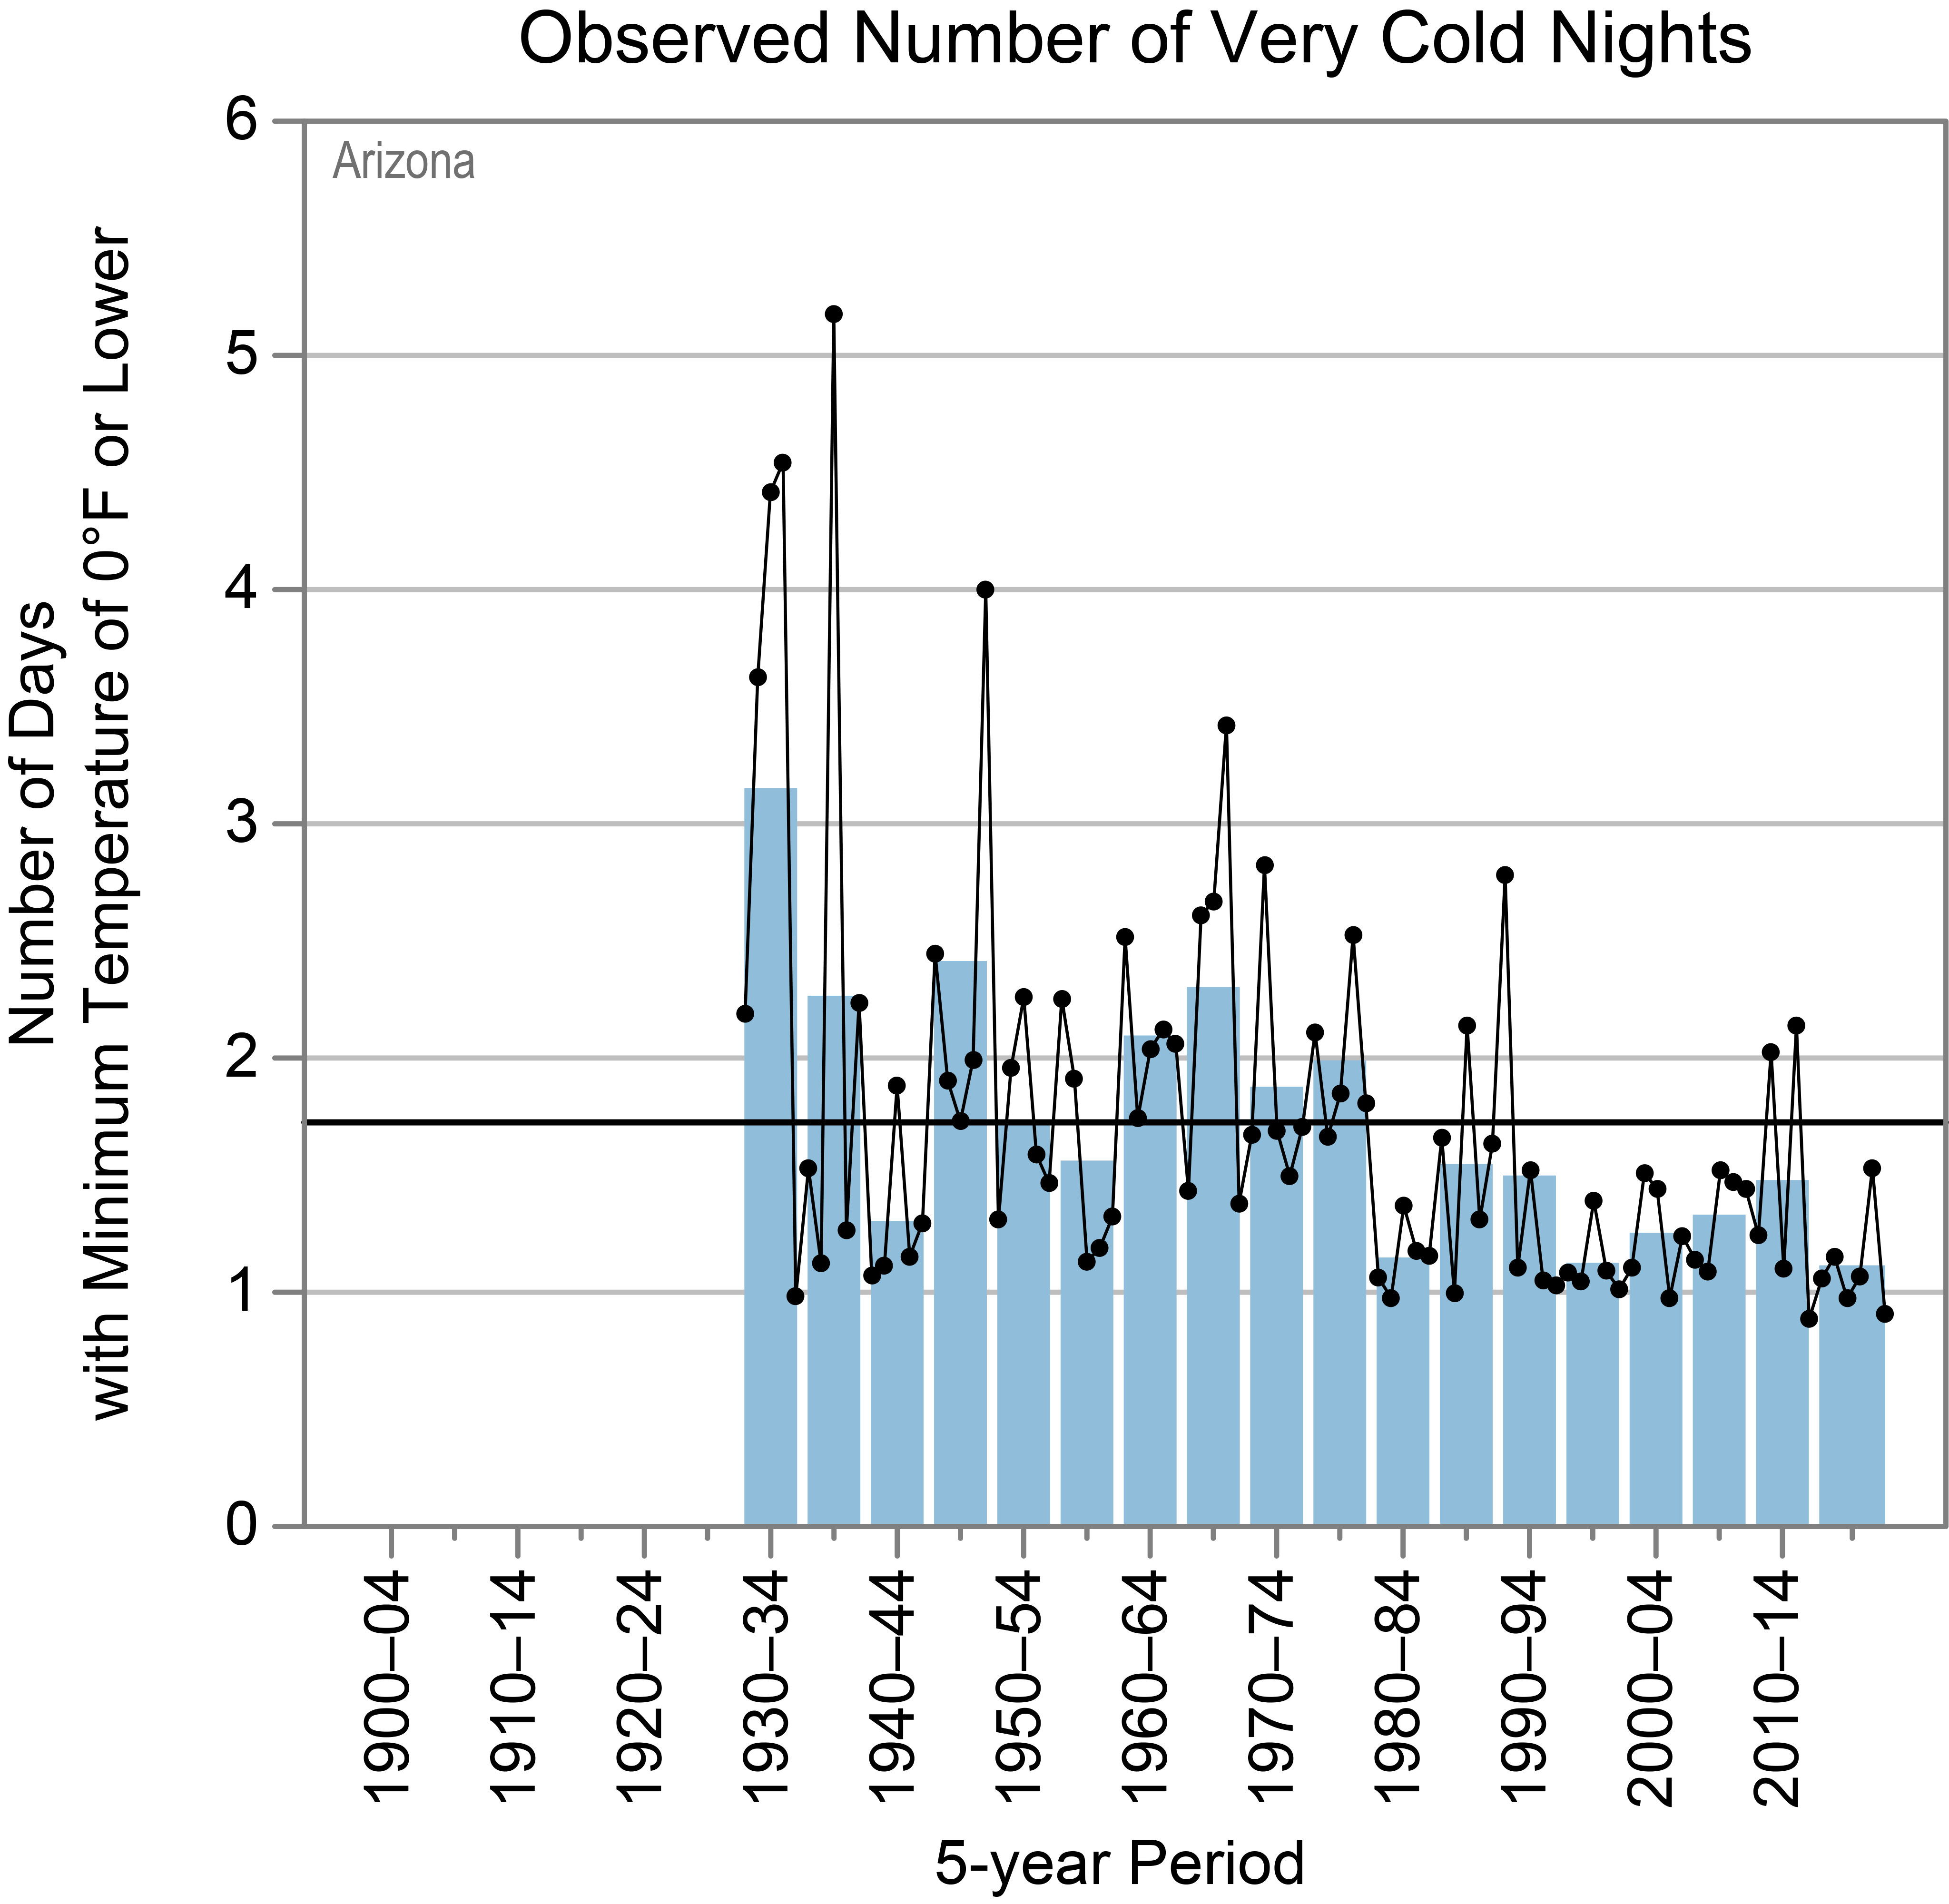
Temperatures in Arizona have risen about 2.5°F since the beginning of the 20th century. The first 21 years of this century have been the warmest period on record for the state (Figure 1). Since 1995, the number of days with a maximum temperature of 100°F or higher has been near to above average, reaching a record high during the 2015 to 2020 period (Figure 2a).The number of nights with a minimum temperature of 80°F or higher has been trending upward since 1995, also reaching a record high during the 2015 to 2020 period (Figure 3); this increase in high nighttime minimums is observed statewide, but the increase is much larger in the Phoenix metropolitan area. The number of nights with a minimum temperature of 0°F or lower has been below average since 1980 (Figure 4). One notable trend is an increase in both daytime high and nighttime low summer temperatures, which has implications for the intensity of future heat waves in a state that already experiences very hot conditions (Figures 2b and 2c).
Figure 2
a)
b)
c)
d)
e)
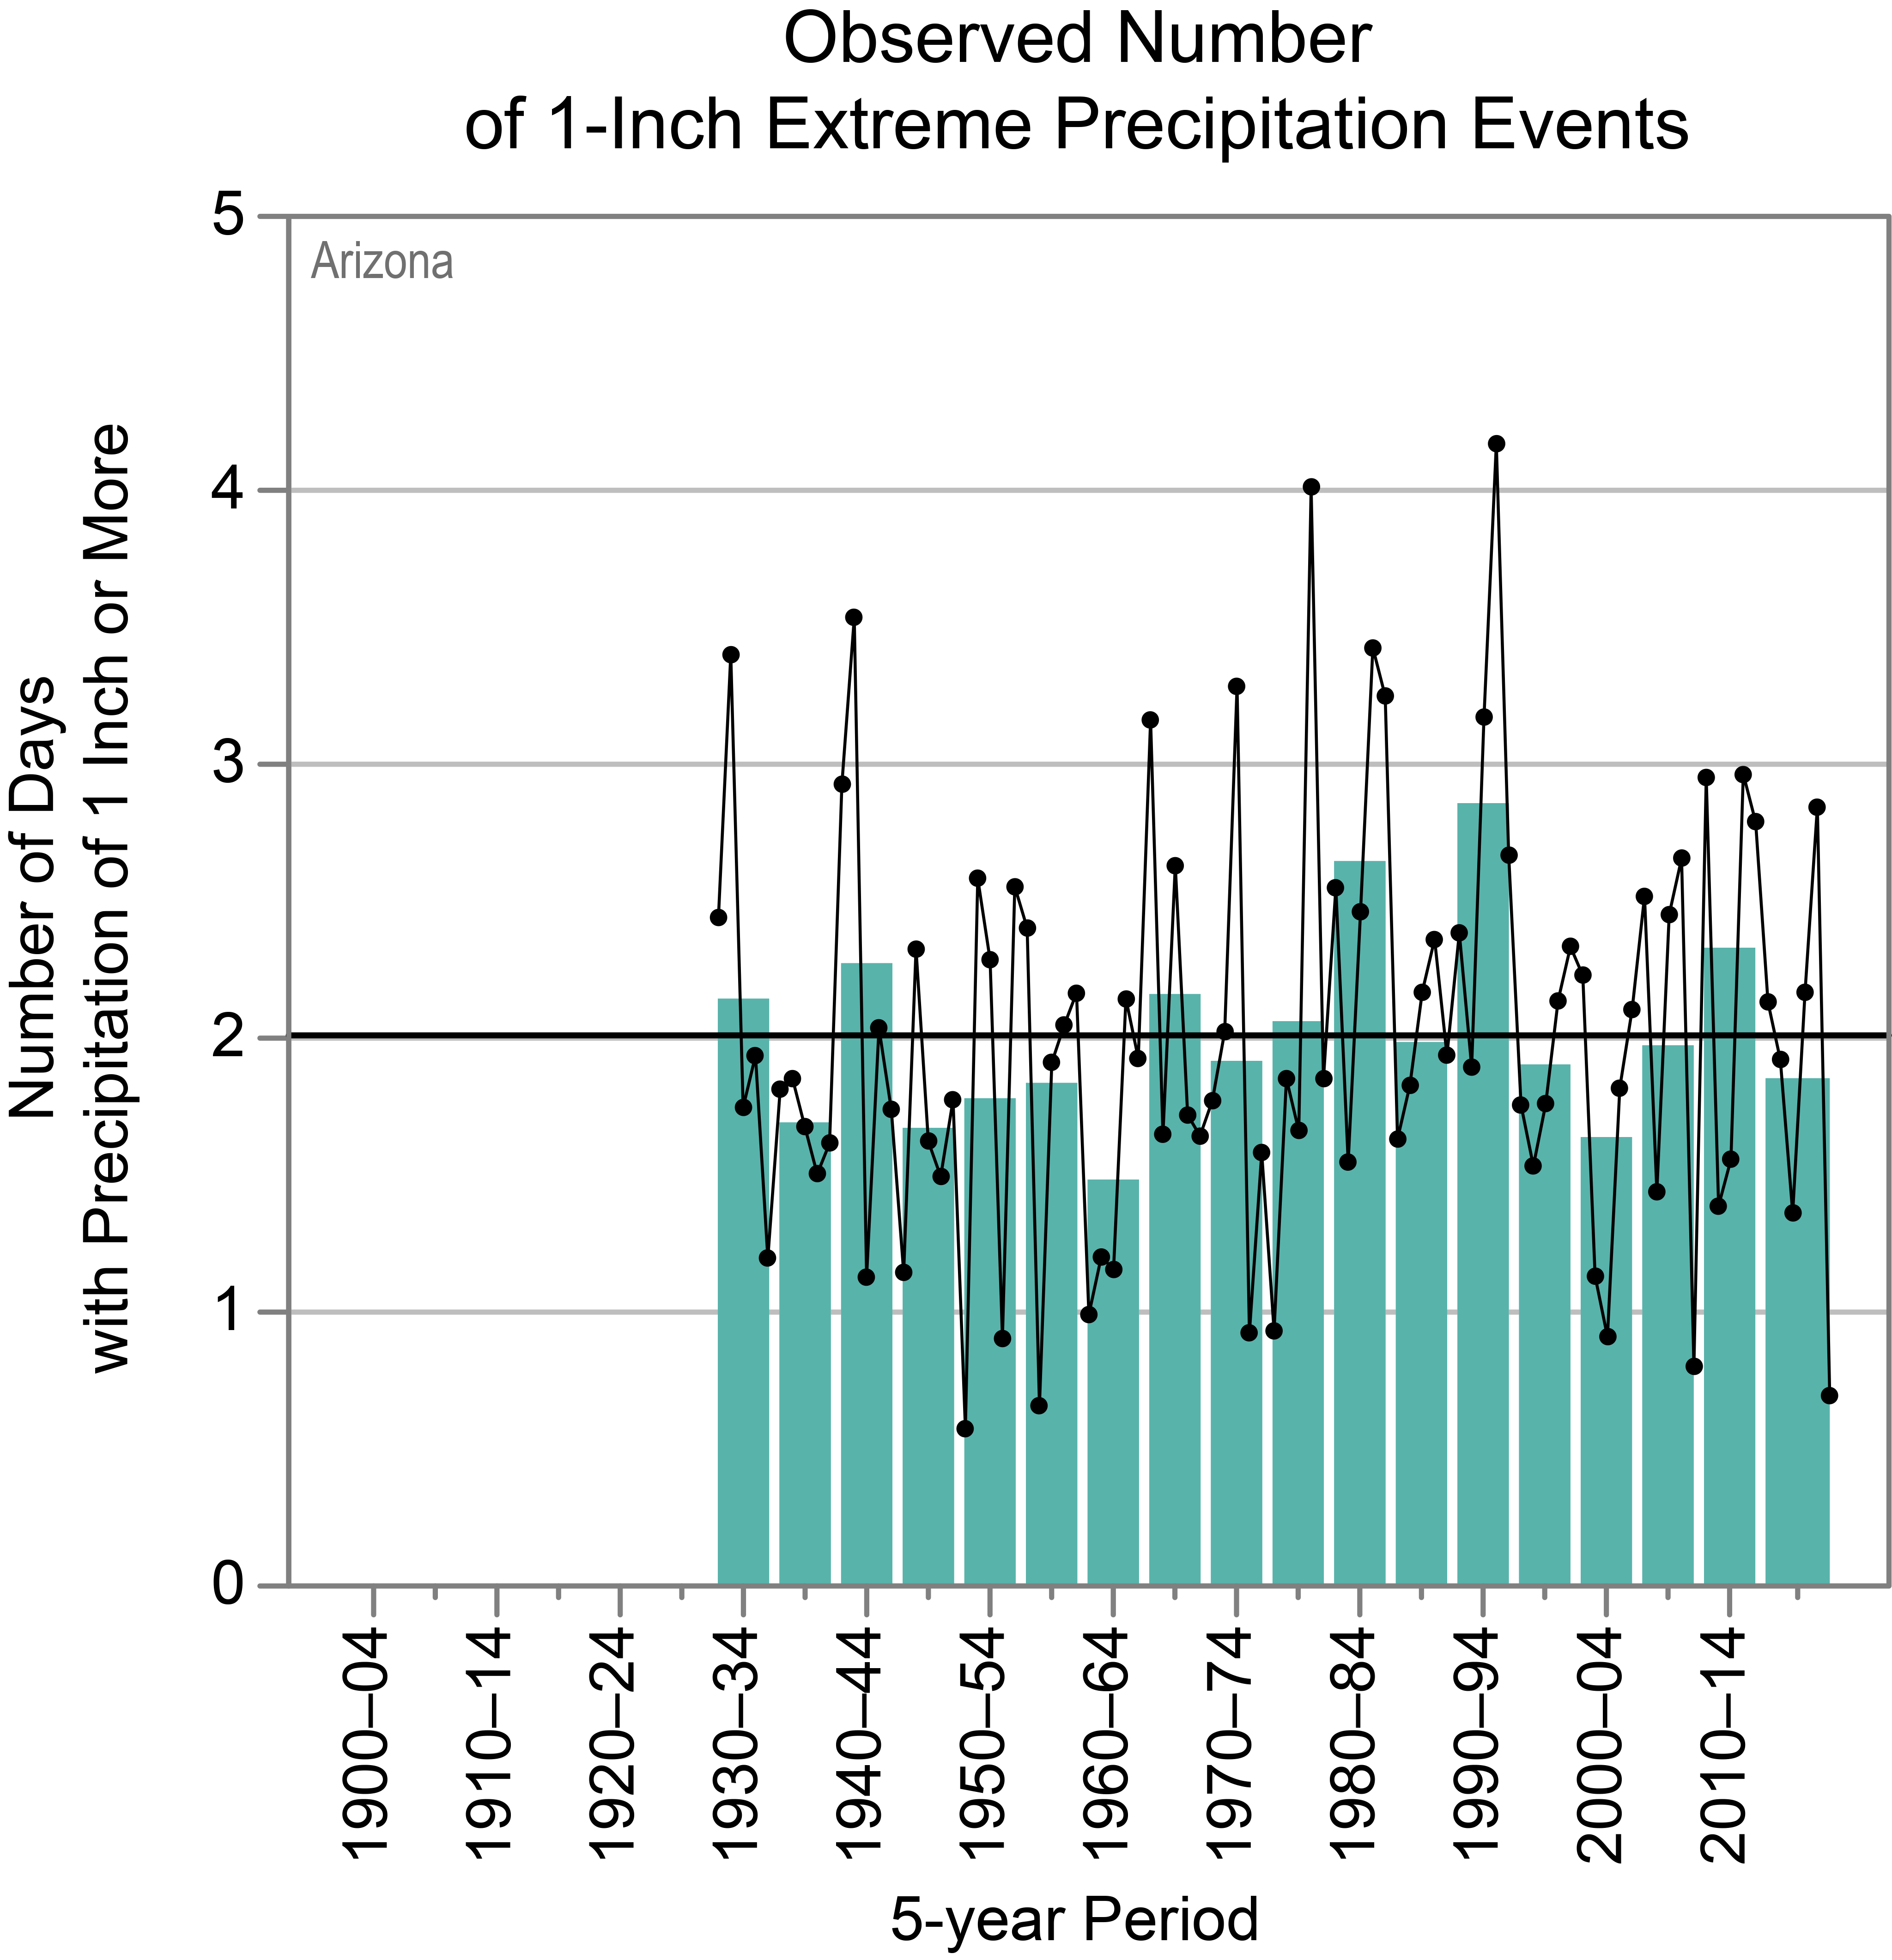
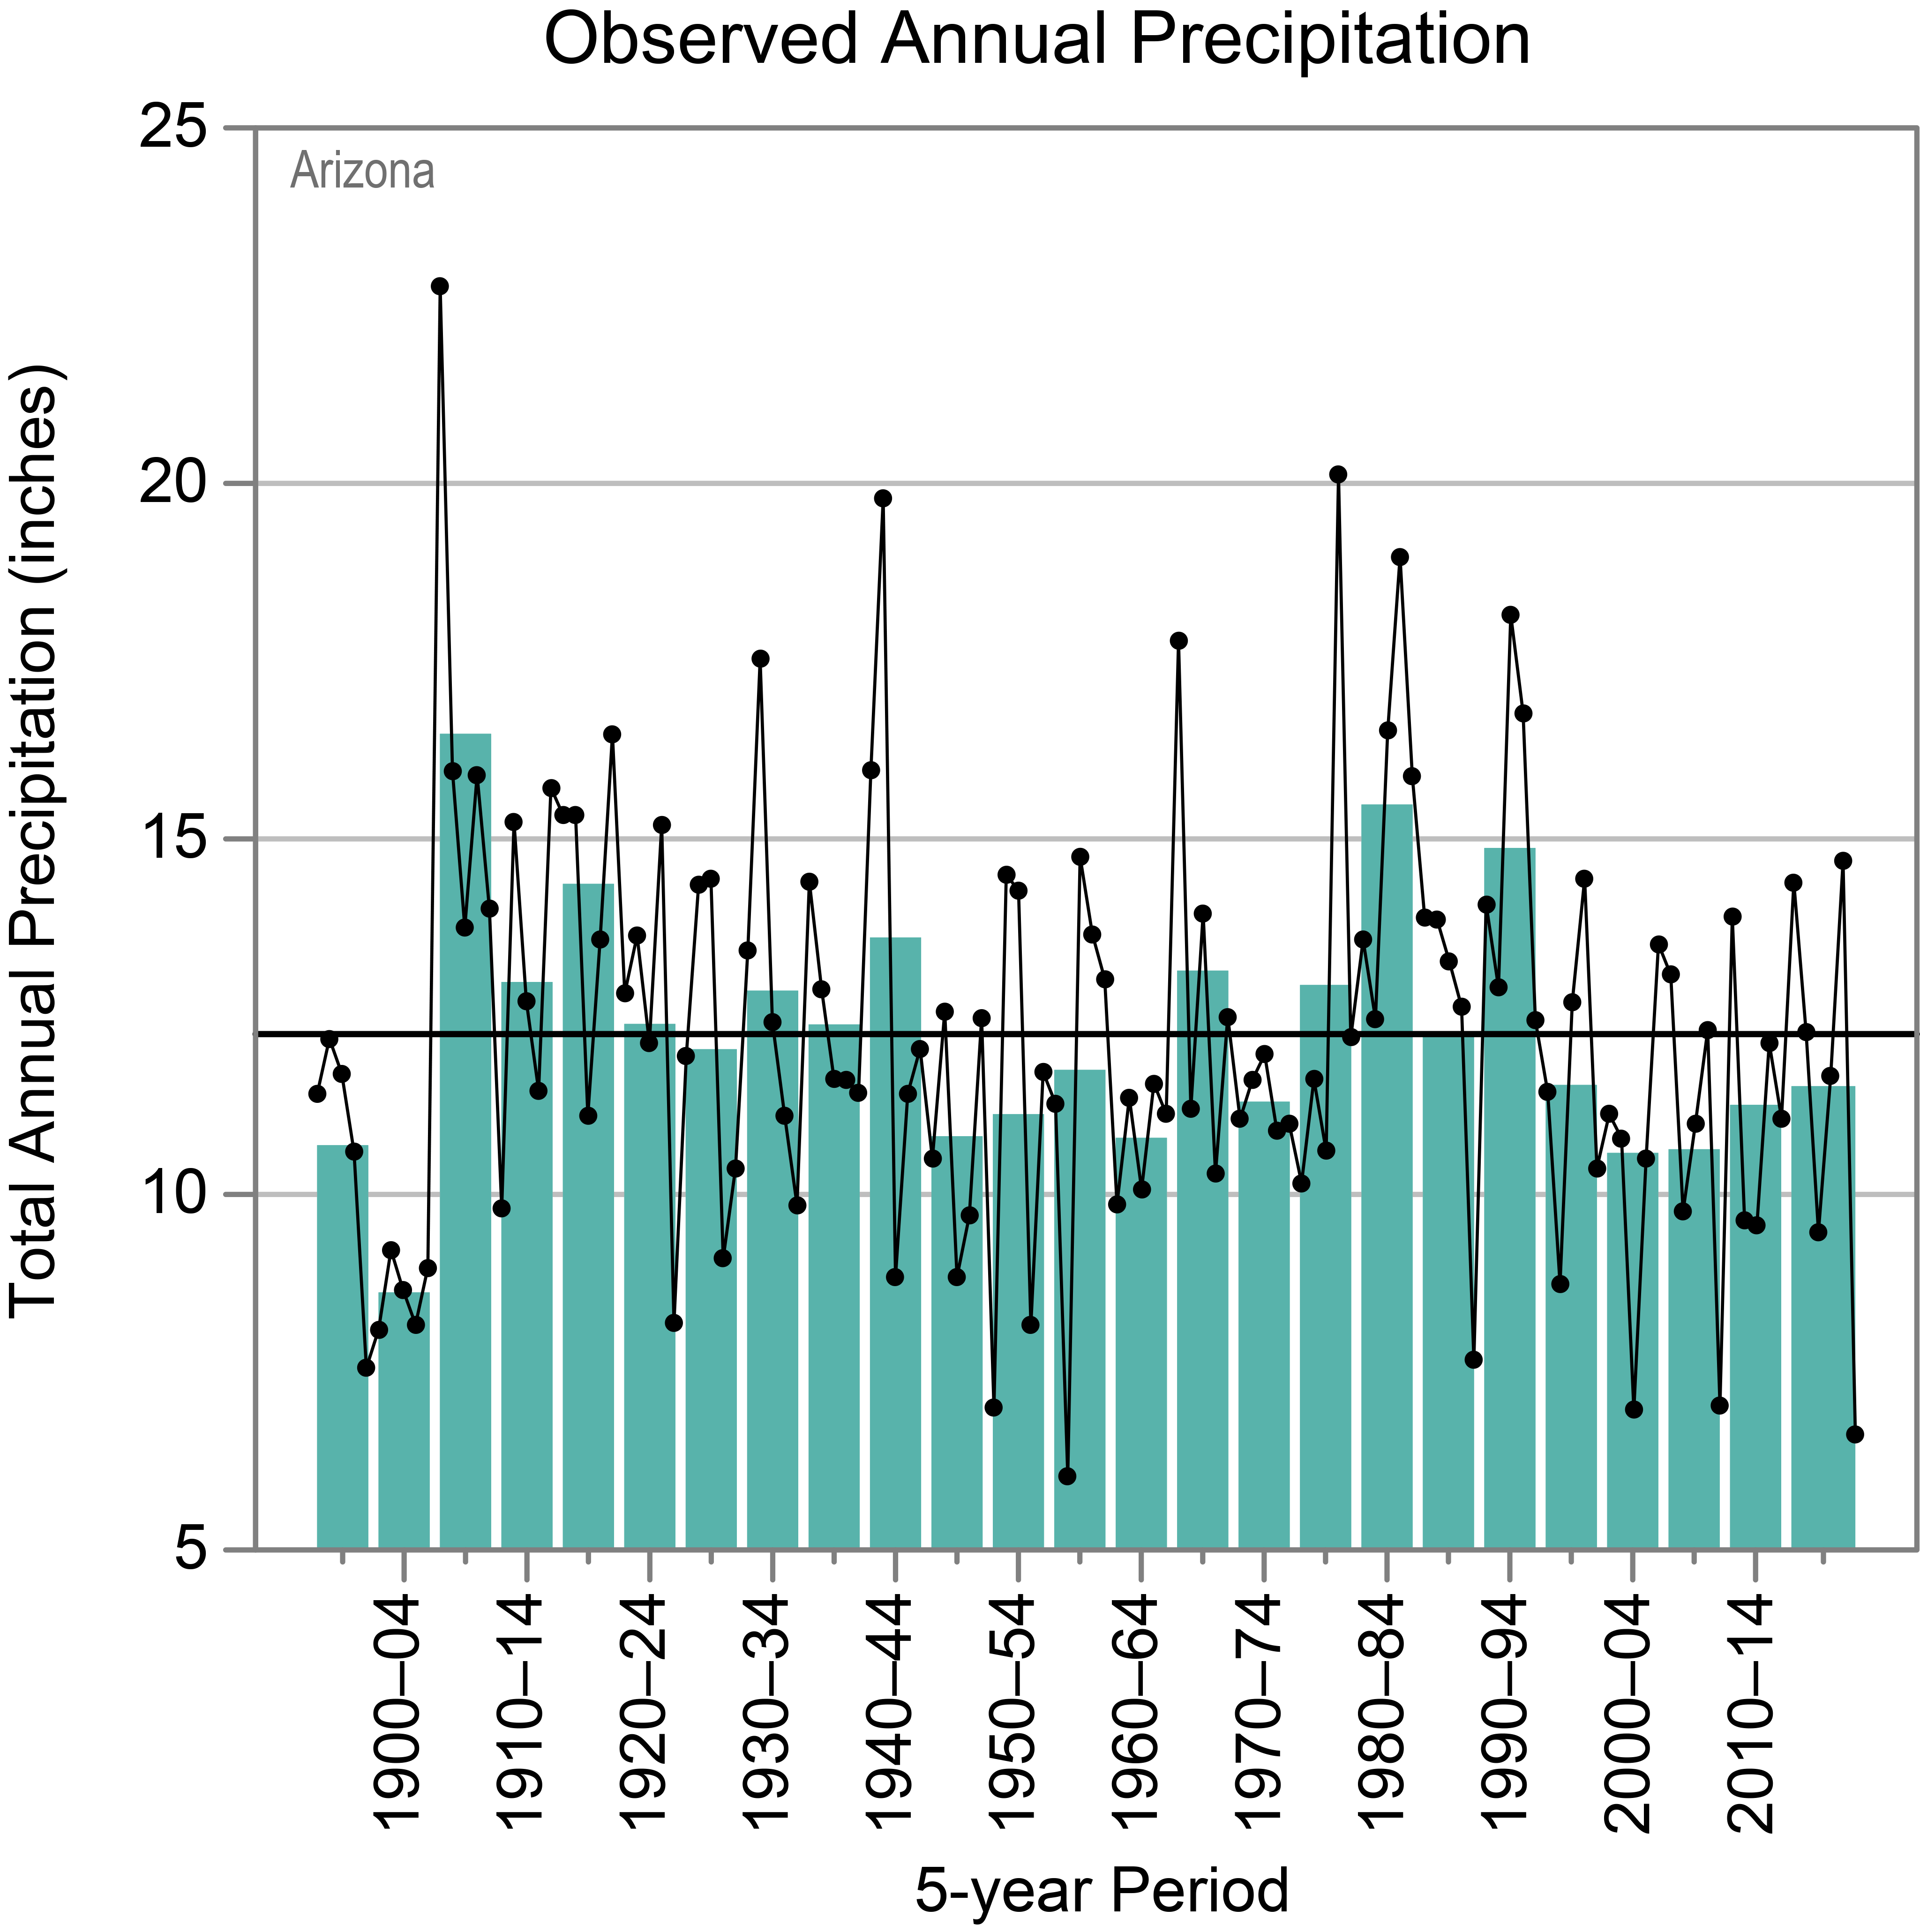
Figure 2: Observed (a) annual number of extremely hot days (maximum temperature of 100°F or higher), (b) summer (June–August) average maximum temperature, (c) summer average minimum temperature, (d) total annual precipitation, and (e) annual number of 1-inch extreme precipitation events (days with precipitation of 1 inch or more) for Arizona from (a, e) 1930 to 2020 and (b, c, d) 1895 to 2020. Dots show annual values. Bars show averages over 5-year periods (last bar is a 6-year average). The horizontal black lines show the long-term (entire period) averages: (a) 38 days, (b) 92.3°F, (c) 63.0°F, (d) 12.3 inches, (e) 2.0 days. (Note that for Figures 2a and 2e, the average for individual reporting stations varies greatly because of the state’s large elevation range.) The number of extremely hot days has been above average since 1995, with the highest number occurring during the 2015–2020 period. Both summer average maximum (daytime) and minimum (nighttime) temperatures show an upward trend, with the highest values for both occurring since 2000. Total annual precipitation varies widely but has been below average since 1995. The annual number of 1-inch extreme precipitation events shows no long-term trend; a typical reporting station experiences 2 events per year. Sources: CISESS and NOAA NCEI. Data: (a) GHCN-Daily from 18 long-term stations; (b, c, d) nClimDiv; (e) GHCN-Daily from 30 long-term stations.
Much of Arizona is characterized as arid to semiarid, with annual average precipitation ranging from less than 4 inches in the southwest to around 40 inches in the White Mountains in the east-central region. Precipitation is highly variable from year to year, with statewide total annual precipitation ranging from a low of 6.0 inches in 1956 to a high of 22.8 inches in 1905. The driest multiyear period occurred during the early 1900s and was immediately followed by the wettest multiyear period (Figure 2d). The driest consecutive 5-year interval was 1899–1903, with an annual average of 8.3 inches of precipitation, and the wettest was 1905–1909, with an annual average of 16.5 inches. The years since 1995 have also been relatively dry, with 17 of the last 26 years experiencing below average precipitation. Snowfall is rare in the southern desert region but does occur at the higher elevations, where it can reach depths of more than 100 inches. Snowpack plays a critical role in supplying water for both urban and agricultural areas in the lower Salt River valley and the lower Gila River valley and is vital for forest health and groundwater recharge across the entire state.
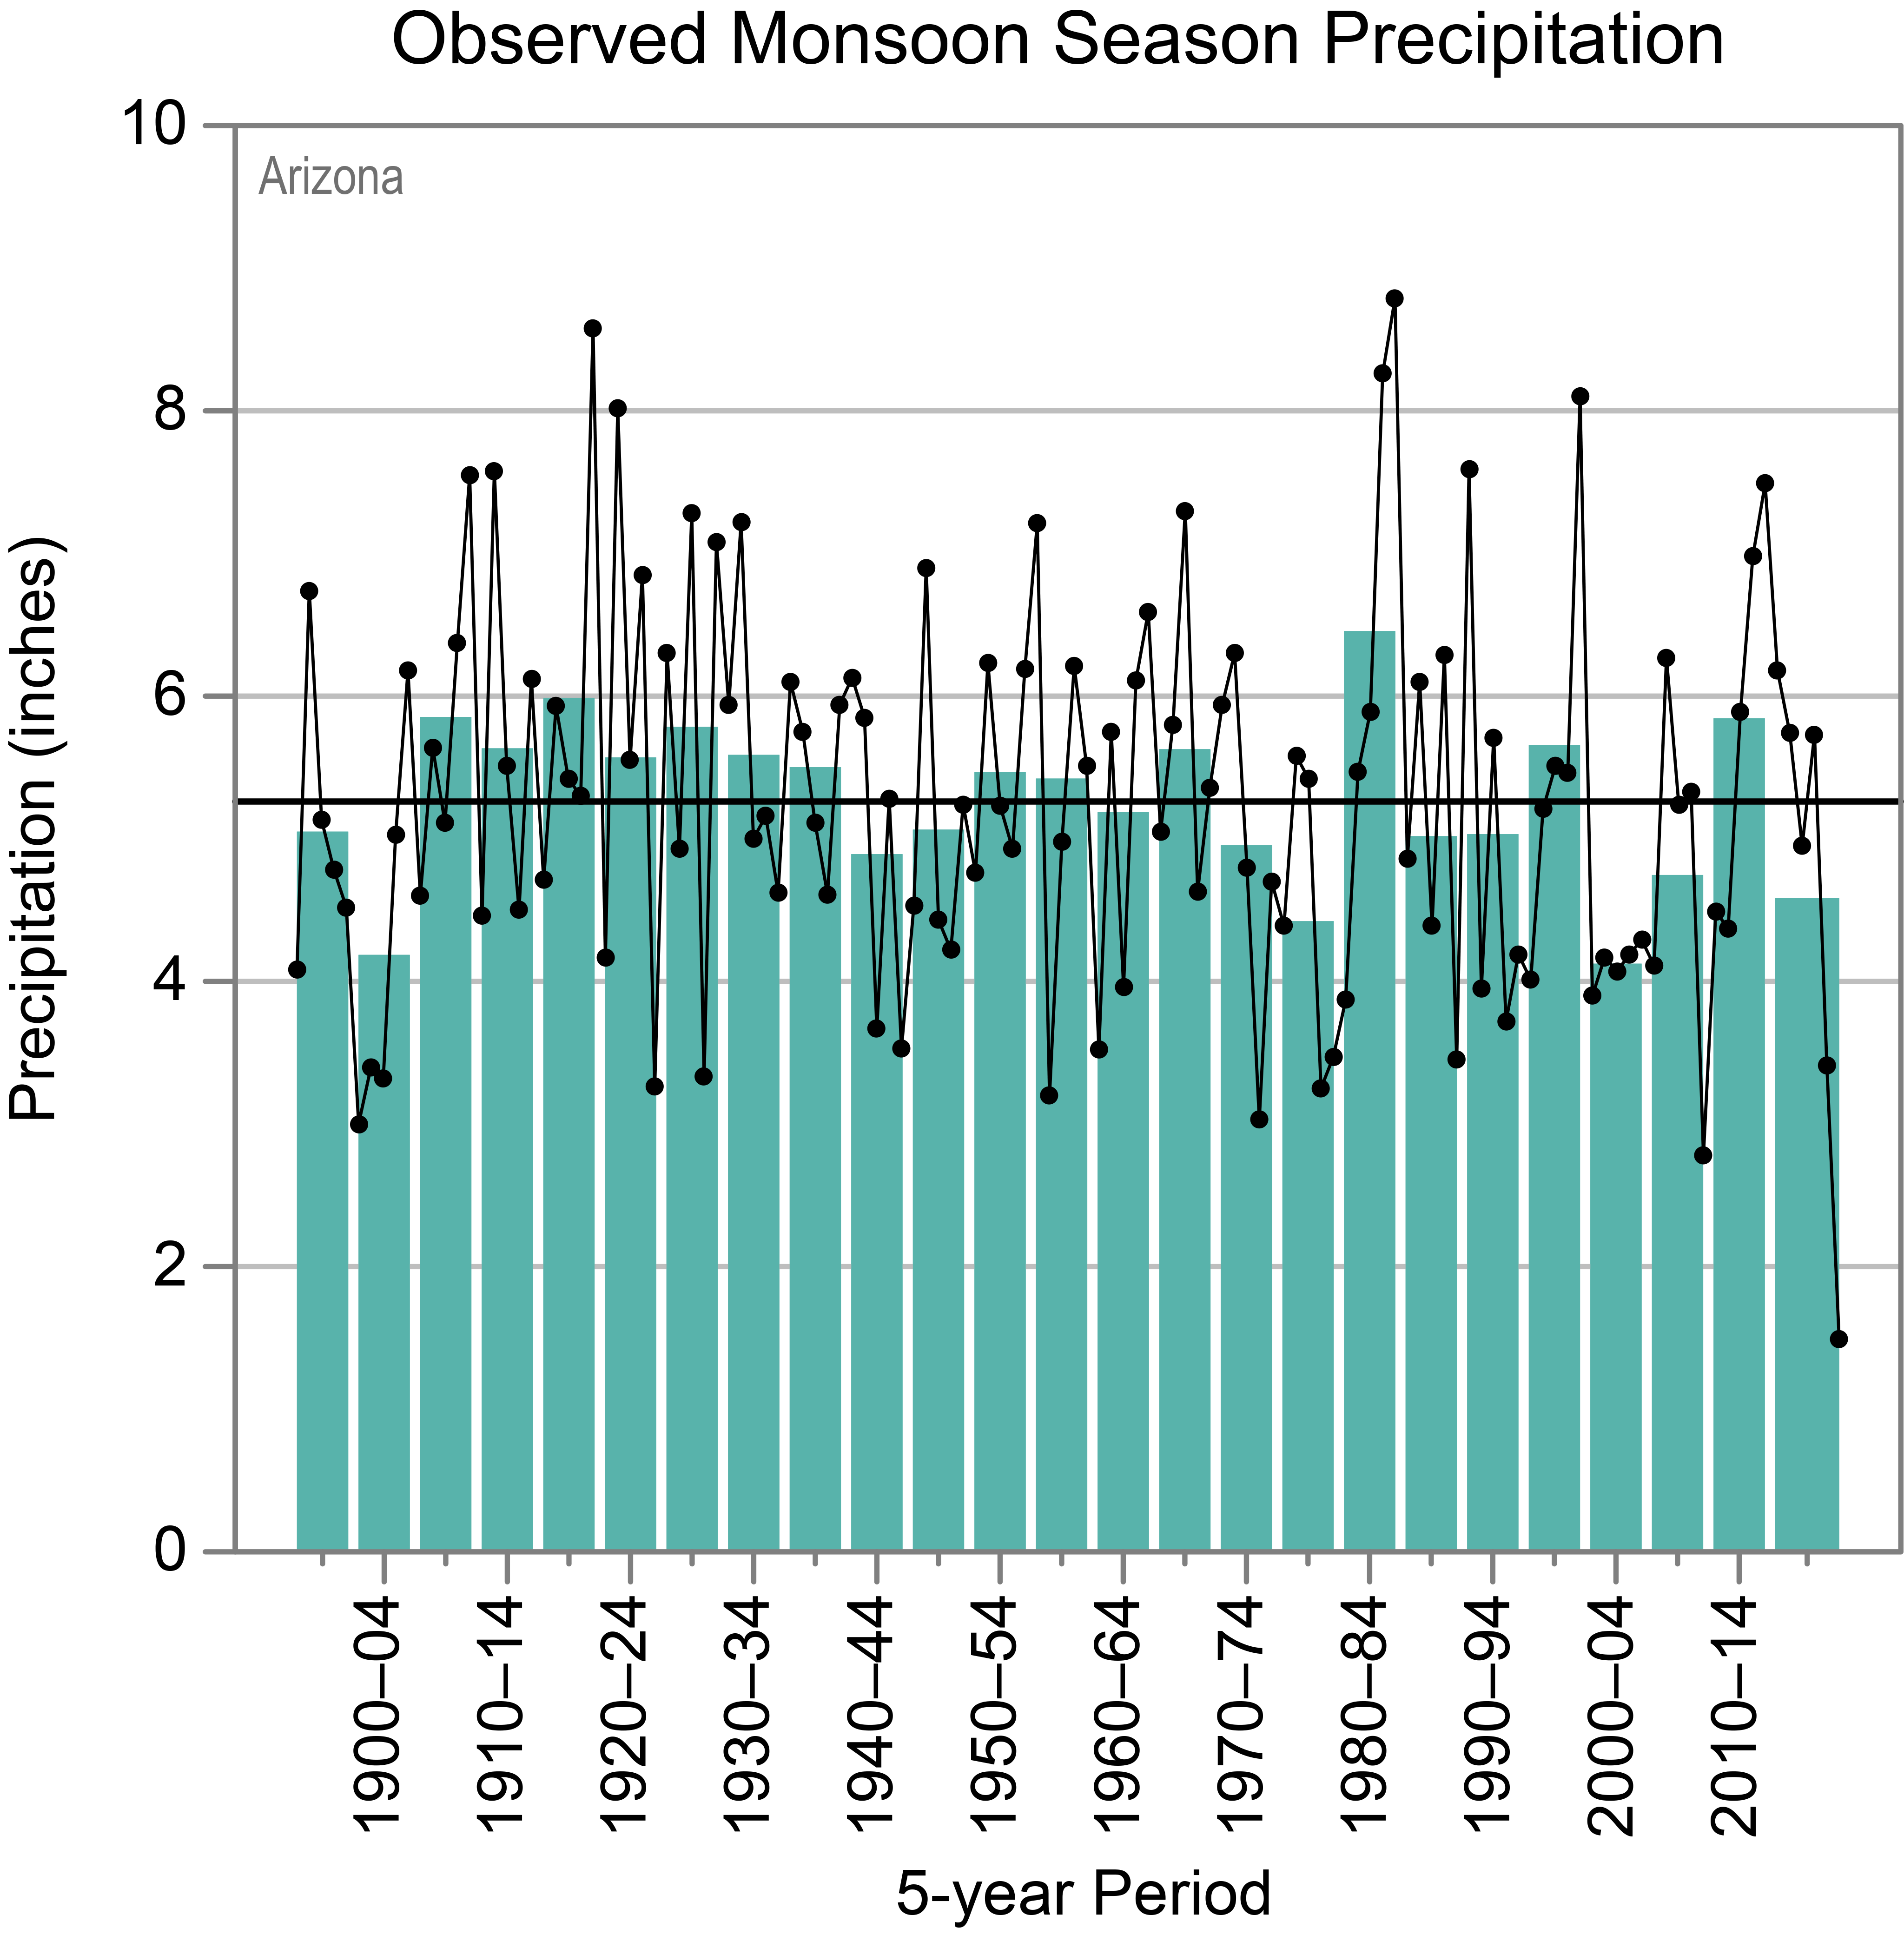
An important feature of Arizona’s summer climate is the North American Monsoon, which causes large amounts of rain to fall from late June or early July to mid-September. Precipitation during the monsoon season is highly variable from year to year (Figure 5). Since 2000, monsoon precipitation has been below average, with the exception of the 2010–2014 period, which was above average due to warmer sea surface temperatures off the Pacific coast and a very active hurricane season in 2014. In the southernmost portion of the state, monsoon rainfall accounts for more than half of the annual precipitation and plays an important role in supporting agriculture and ecosystems. The monsoon rains are highly beneficial but can occasionally be destructive. On September 8, 2014, extremely heavy monsoon rain associated with a decaying eastern Pacific hurricane caused significant damage and flooding around the Phoenix area. The record for single-day rainfall was broken, with several stations reporting more than 4 inches. The 2020 monsoon season was the driest on record, with only 1.5 inches of precipitation, well below the previous record low of 2.8 inches in 2009.
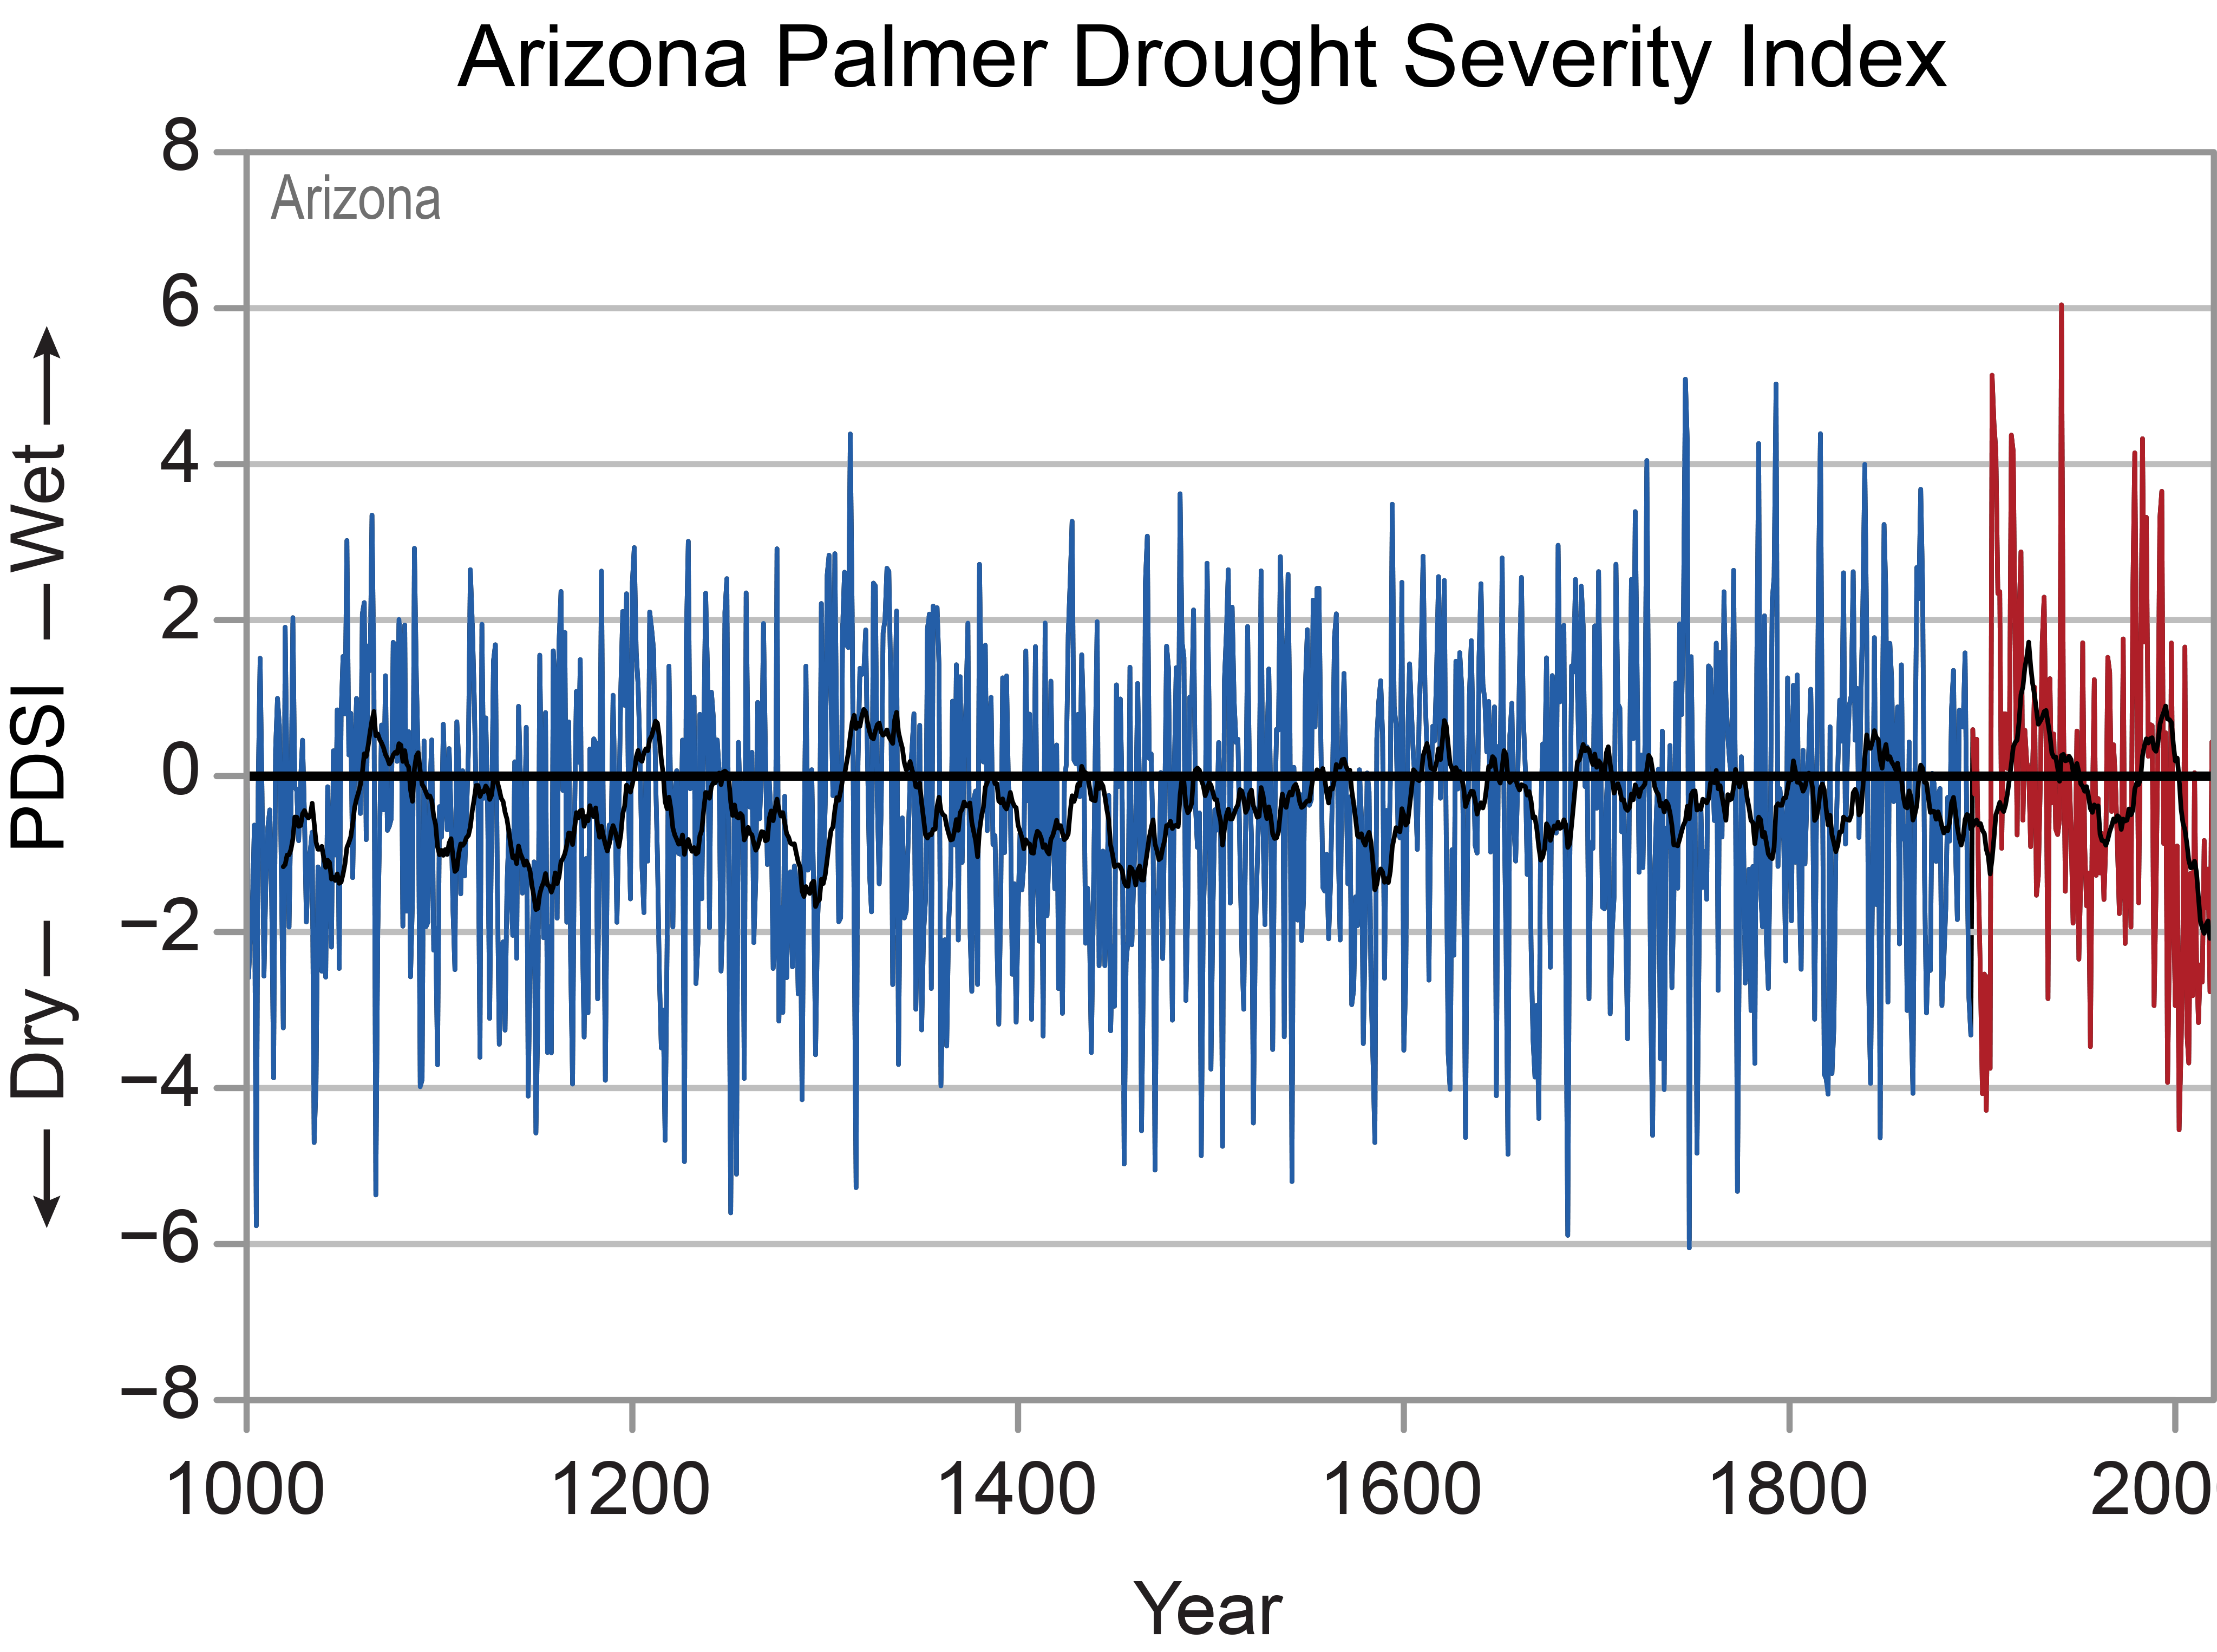
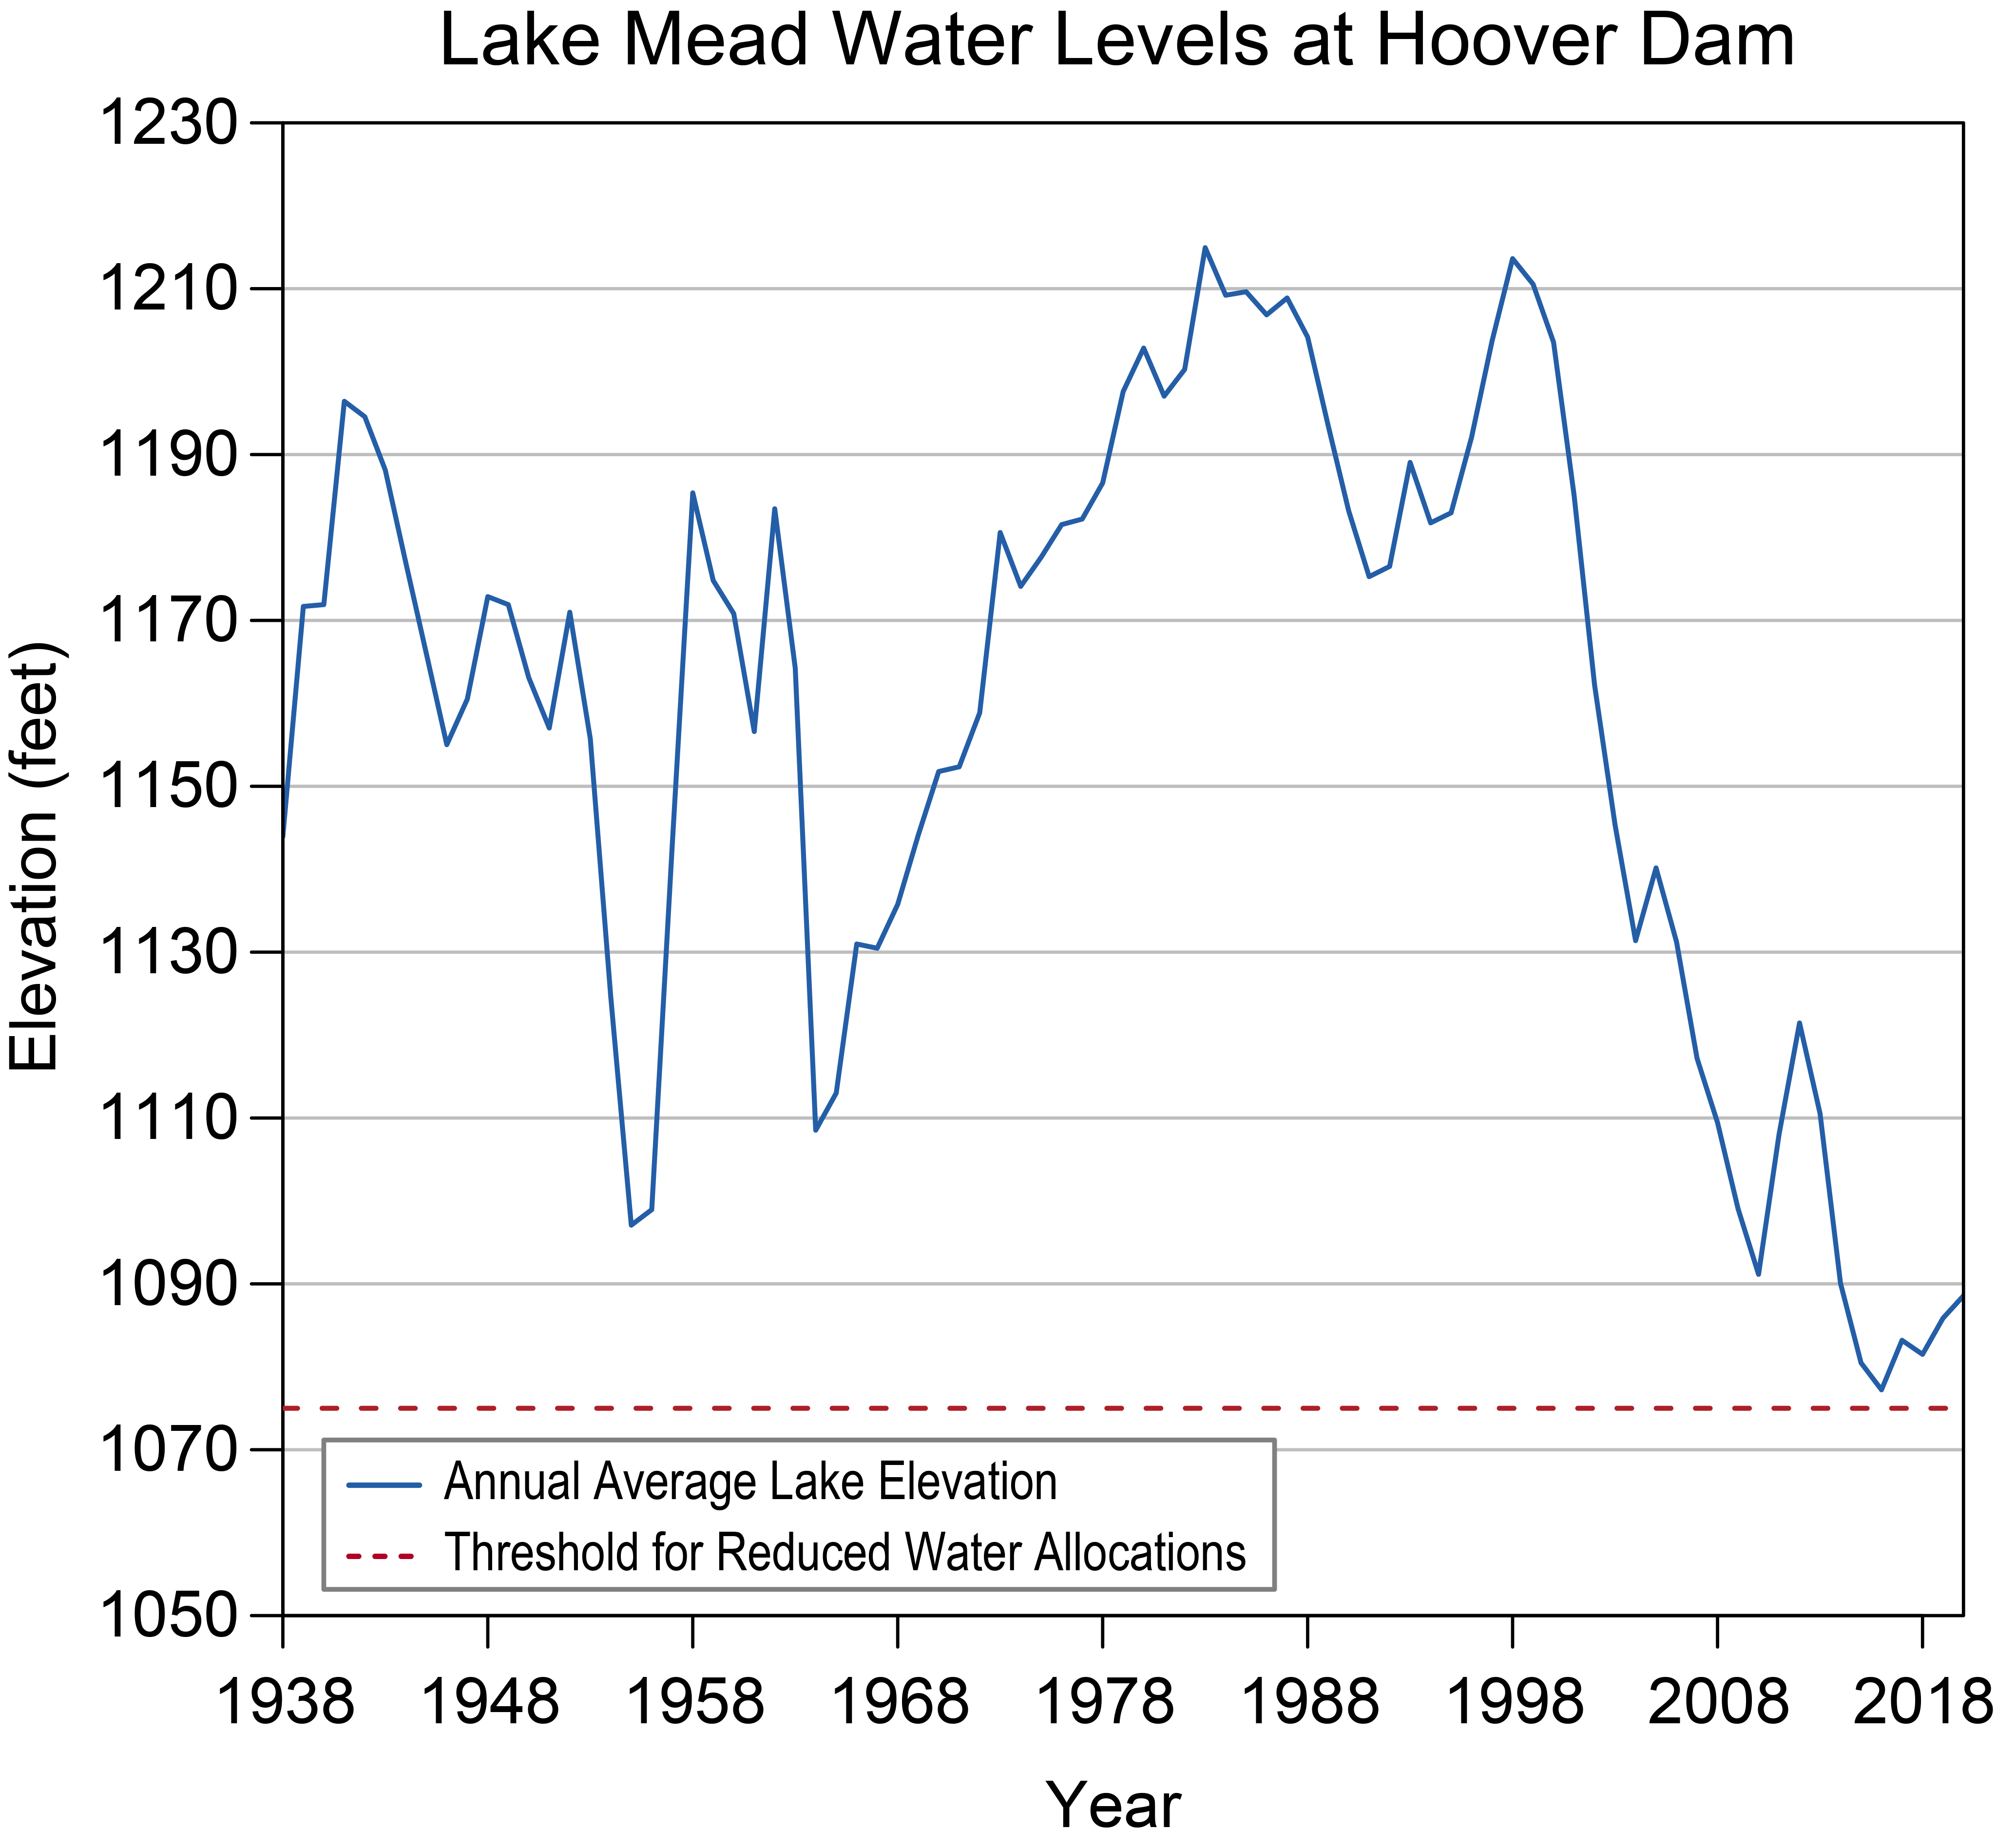
The historical record indicates periodic prolonged wet and dry periods (Figure 6). Arizona is currently in a long-term drought that has lasted more than 20 years. Multiyear periods of high and low precipitation can cause significant variations in reservoir supplies. The latest western U.S. drought has resulted in record-low water levels in Lake Mead, which is a critical water resource for Arizona, as well as southern Nevada, southern California, and northern Mexico. Since reaching high levels in the late 1990s, water levels have been falling, reaching historic lows in 2015 and 2016 (Figure 7). Long-term droughts also raise the risk of wildfires, already a concern for this arid state. In 2011, the Wallow Fire consumed more than 500,000 acres in eastern Arizona, making it the state’s largest wildfire on record.
Unlike many areas of the United States, Arizona and other southwestern states have not experienced an upward trend in the frequency of extreme precipitation events. The number of 1-inch extreme precipitation events has been variable throughout the period of record (Figure 2e). Since the 1990s, the number of these events has been near to below normal, with the exception of the 2010–2014 period.
Under a higher emissions pathway, historically unprecedented warming is projected during this century (Figure 1). Even under a lower emissions pathway, annual average temperatures are projected to most likely exceed historical record levels by the middle of the century. However, a large range of temperature increases is projected under both pathways, and under the lower pathway, a few projections are only slightly warmer than historical records. Extreme heat is a particular concern for Phoenix and other urban areas, where the urban heat island effect raises summer nighttime temperatures. Rising temperatures will increase the intensity of future heat waves, which is a concern for a state that already experiences extremely hot conditions.
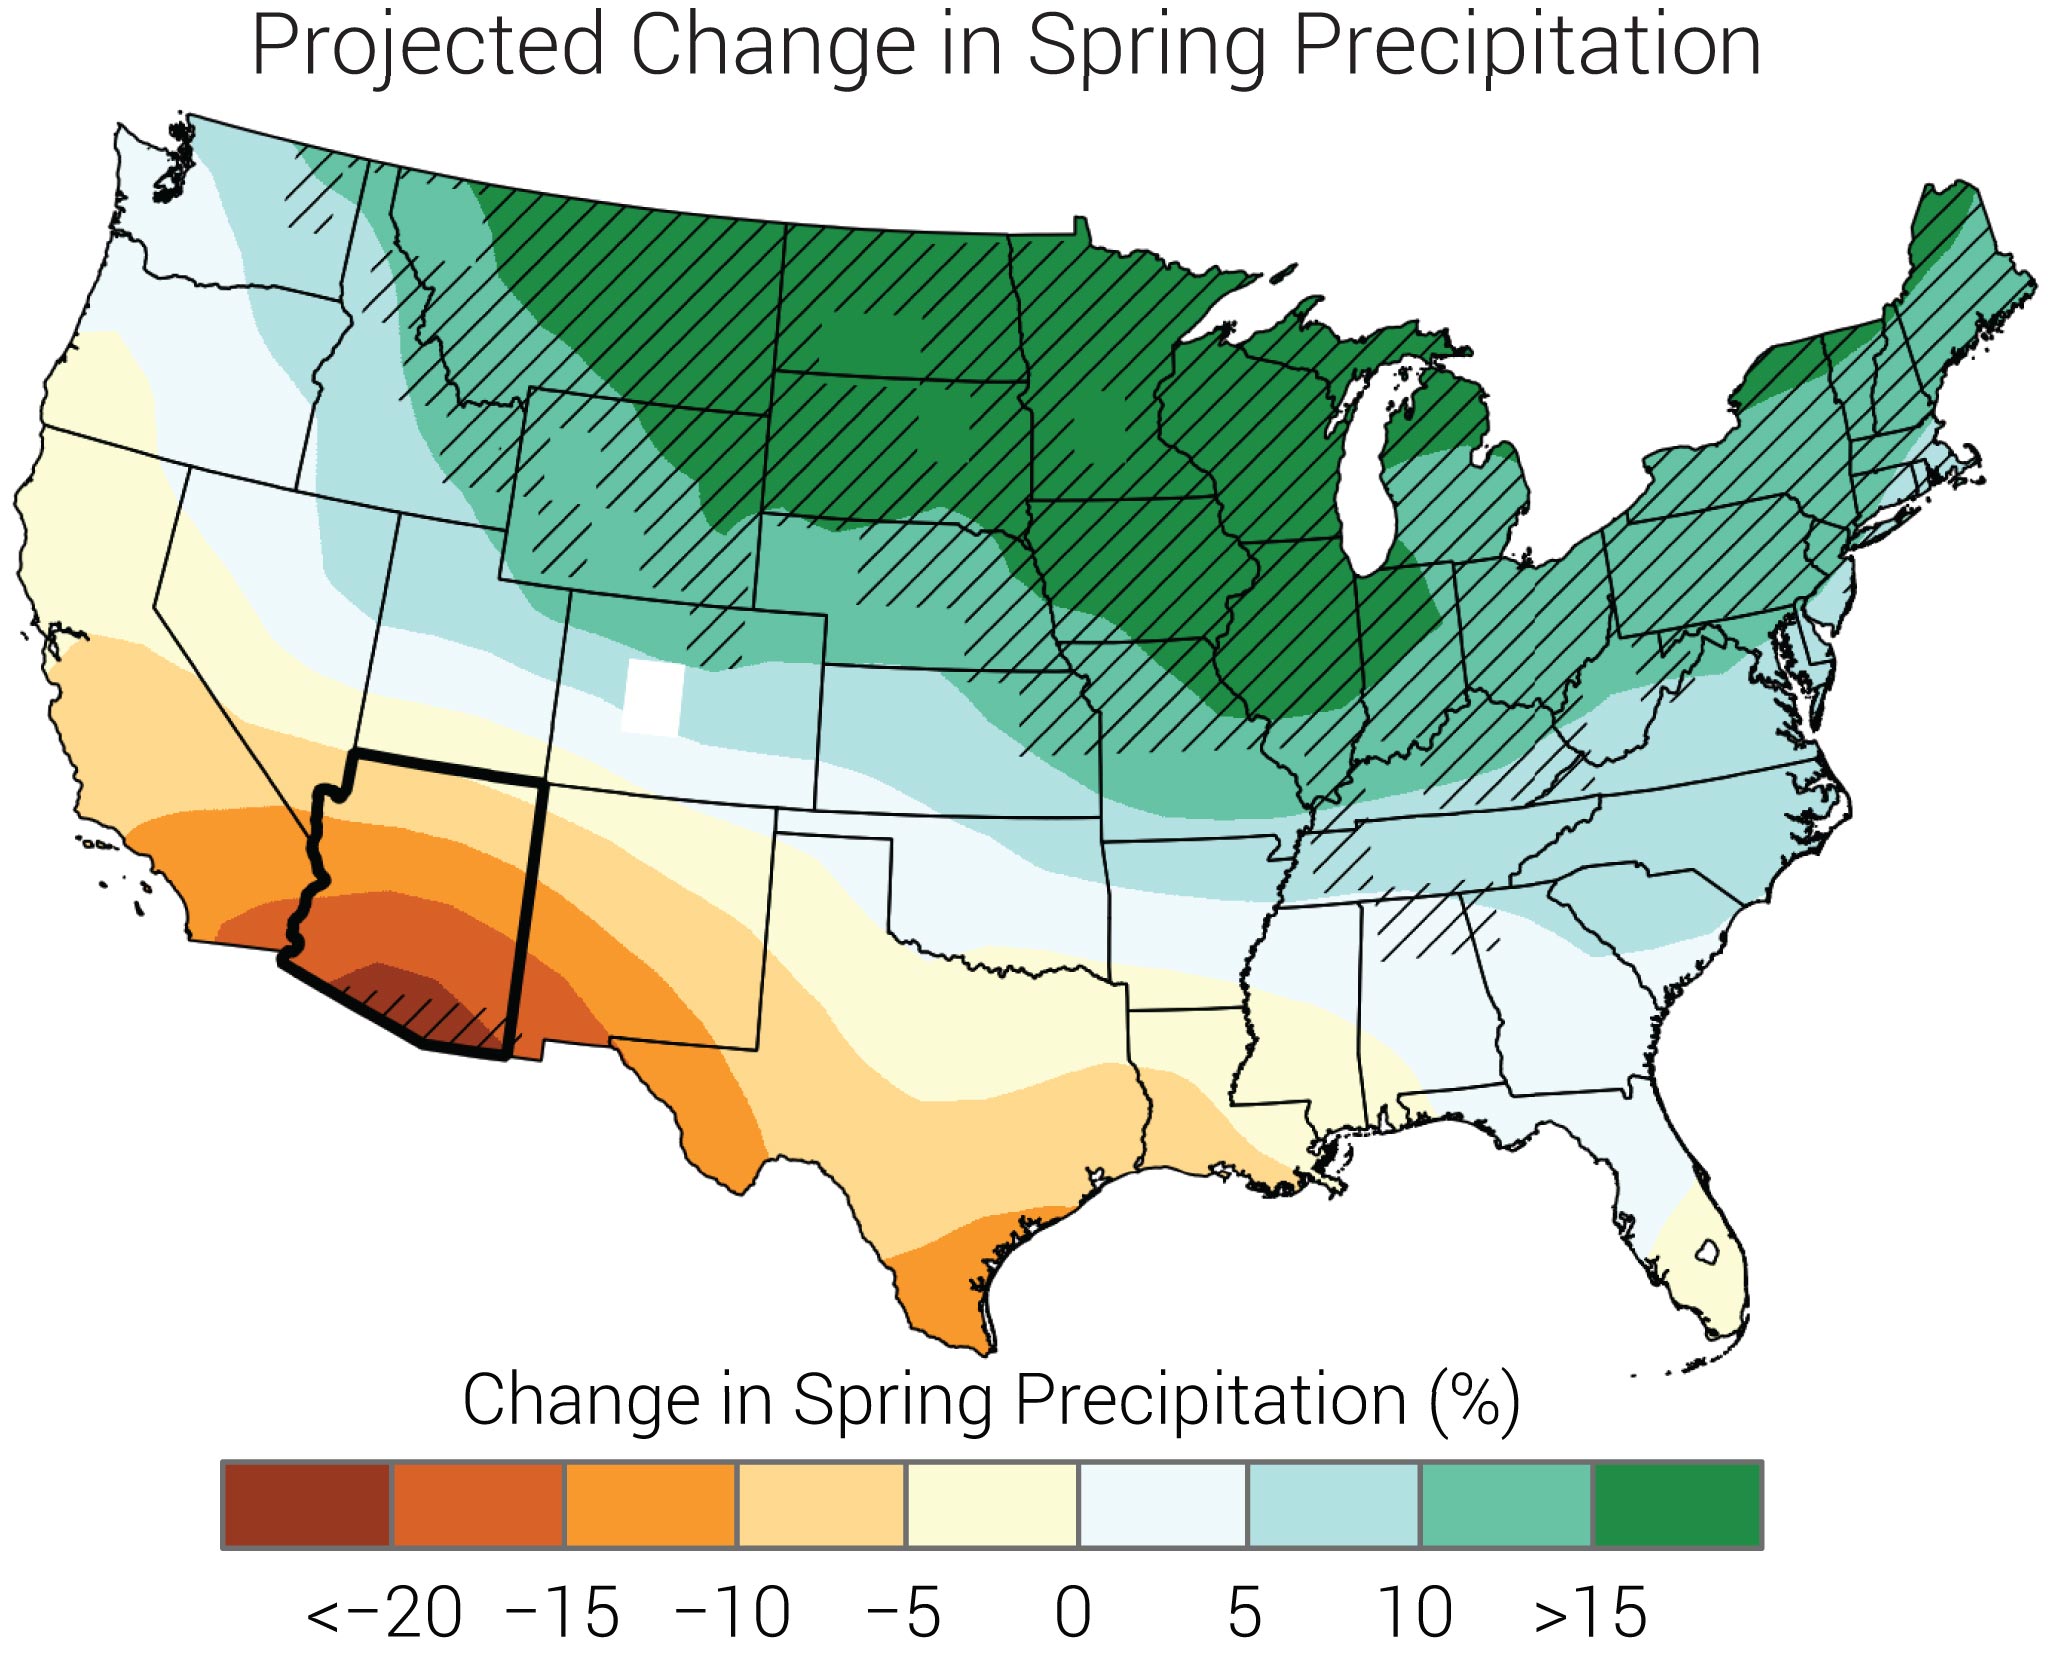
Although projections of overall annual precipitation are uncertain, there is a risk of decreases in spring precipitation (Figure 8); Arizona is on the northern fringe of an area of projected decreases over Mexico and Central America. Additionally, projected rising temperatures will raise the snow line—the average lowest elevation at which snow falls. This will increase the likelihood that precipitation will fall as rain instead of snow, reducing water storage in the snowpack, particularly at lower mountain elevations that are now on the margins of reliable snowpack accumulation. Higher spring temperatures will also result in earlier melting of the snowpack, further decreasing water resources needed for irrigation during the hot summer months.
Naturally occurring droughts are expected to become more intense during the cool season. As noted above, future projections of overall precipitation are uncertain, including those related to the North American Monsoon. However, even if precipitation does not decrease, higher temperatures will intensify naturally occurring droughts by increasing water evaporation. This will further reduce streamflow, soil moisture, and water supplies. Drought will not only challenge limited agricultural resources but also increase the frequency of dust storms and the frequency of the risk of very large wildfires.
Details on observations and projections are available on the Technical Details and Additional Information page.
RESOURCES
- ADWR, n.d.: Climate of the Eastern Plateau Planning Area. Arizona Department of Water Resources, Phoenix, AZ. https://web.archive.org/web/20190113193939/http://www.azwater.gov/AzDWR/StatewidePlanning/WaterAtlas/EasternPlateau/PlanningAreaOverview/Climate.htm
- Barbero, R., J.T. Abatzoglou, N.K. Larkin, C.A. Kolden, and B. Stocks, 2015: Climate change presents increased potential for very large fires in the contiguous United States. International Journal of Wildland Fire, 24 (7), 892–899. https://doi.org/10.1071/WF15083
- Hayhoe, K., D.J. Wuebbles, D.R. Easterling, D.W. Fahey, S. Doherty, J. Kossin, W. Sweet, R. Vose, and M. Wehner, 2018: Our changing climate. In: Impacts, Risks, and Adaptation in the United States: Fourth National Climate Assessment, Volume II. Reidmiller, D.R., C.W. Avery, D.R. Easterling, K.E. Kunkel, K.L.M. Lewis, T.K. Maycock, and B.C. Stewart, Eds. U.S. Global Change Research Program, Washington, DC, 72–144. https://nca2018.globalchange.gov/chapter/2/
- Kunkel, K.E., L.E. Stevens, S.E. Stevens, L. Sun, E. Janssen, D., Wuebbles, K.T. Redmond, and J.G. Dobson, 2013: Regional Climate Trends and Scenarios for the U.S. National Climate Assessment Part 5. Climate of the Southwest U.S. NOAA Technical Report NESDIS 142-5. National Oceanic and Atmospheric Administration, National Environmental Satellite, Data, and Information Service, Silver Spring, MD, 87 pp. https://nesdis-prod.s3.amazonaws.com/migrated/NOAA_NESDIS_Tech_Report_142-5-Climate_of_the_Southwest_U.S.pdf
- MRCC, n.d.: cli-MATE: MRCC Application Tools Environment. Midwestern Regional Climate Center, Urbana-Champaign, IL. https://mrcc.illinois.edu/CLIMATE/
- NOAA NCDC, n.d.: Climate of Arizona. National Oceanic and Atmospheric Administration, National Climatic Data Center, Asheville, NC, 4 pp. https://www.ncei.noaa.gov/data/climate-normals-deprecated/access/clim60/states/Clim_AZ_01.pdf
- NOAA NCEI, n.d.: Climate at a Glance: Statewide Time Series, Arizona. National Oceanic and Atmospheric Administration, National Centers for Environmental Information, Asheville, NC, accessed May 10, 2021. https://www.ncdc.noaa.gov/cag/statewide/time-series/2/
- NOAA NCEI, n.d.: Drought Variability [Data Access: Palmer Drought Index Studies: North American Drought Atlas (NADA) (Version 2a)]. National Oceanic and Atmospheric Administration, National Centers for Environmental Information. https://www.ncei.noaa.gov/products/paleoclimatology/drought-variability
- NOAA NCEI, n.d.: State Climate Extremes Committee (SCEC): Records. National Oceanic and Atmospheric Administration, National Centers for Environmental Information, Asheville, NC. http://www.ncdc.noaa.gov/extremes/scec/records
- NOAA RCCs ACIS, n.d.: Gridded NCEI Normals Mapper [Arizona]. National Oceanic and Atmospheric Administration Regional Climate Centers, Applied Climate Information System. https://ncei-normals-mapper.rcc-acis.org/
- NPS, n.d.: Lake Mead: Lowering Lake Levels. National Park Service, Washington, DC, last modified September 2, 2020. https://www.nps.gov/lake/learn/nature/lowering-lake-levels.htm
- USBR, n.d.: Lake Mead Annual High and Low Elevations (1935–2020). U.S. Bureau of Reclamation, Lower Colorado Basin Region, Boulder City, NV. https://www.usbr.gov/lc/region/g4000/lakemead_bar.pdf
- USDA FS, 2011: Wallow Fire 2011: Fire/Fuels Report: Apache–Sitgreaves National Forests. U.S. Department of Agriculture, Forest Service, Southwestern Region, Albuquerque, NM, 23 pp. http://www.fs.usda.gov/Internet/FSE_DOCUMENTS/stelprdb5333354.pdf
- Vose, R.S., D.R. Easterling, K.E. Kunkel, A.N. LeGrande, and M.F. Wehner, 2017: Temperature changes in the United States. In: Climate Science Special Report: Fourth National Climate Assessment, Volume I. Wuebbles, D.J., D.W. Fahey, K.A. Hibbard, D.J. Dokken, B.C. Stewart, and T.K. Maycock, Eds. U.S. Global Change Research Program, Washington, DC, 185–206. http://doi.org/10.7930/J0N29V45