OHIO
Ohio’s mid-latitude, interior location and the lack of mountains to the north or south expose the state to incursions of very cold air masses from the Arctic in the winter and warm, humid air masses from the Gulf of Mexico in the summer. Lake Erie also has a significant influence on the local climate. Near-shore locations are considerably warmer during the winter and cooler during the summer than locations farther away from the shores. Lake-effect snow, caused by the warming and moistening of arctic air masses over the Great Lakes, is a hazard along the southeastern shoreline of Lake Erie.
Figure 1

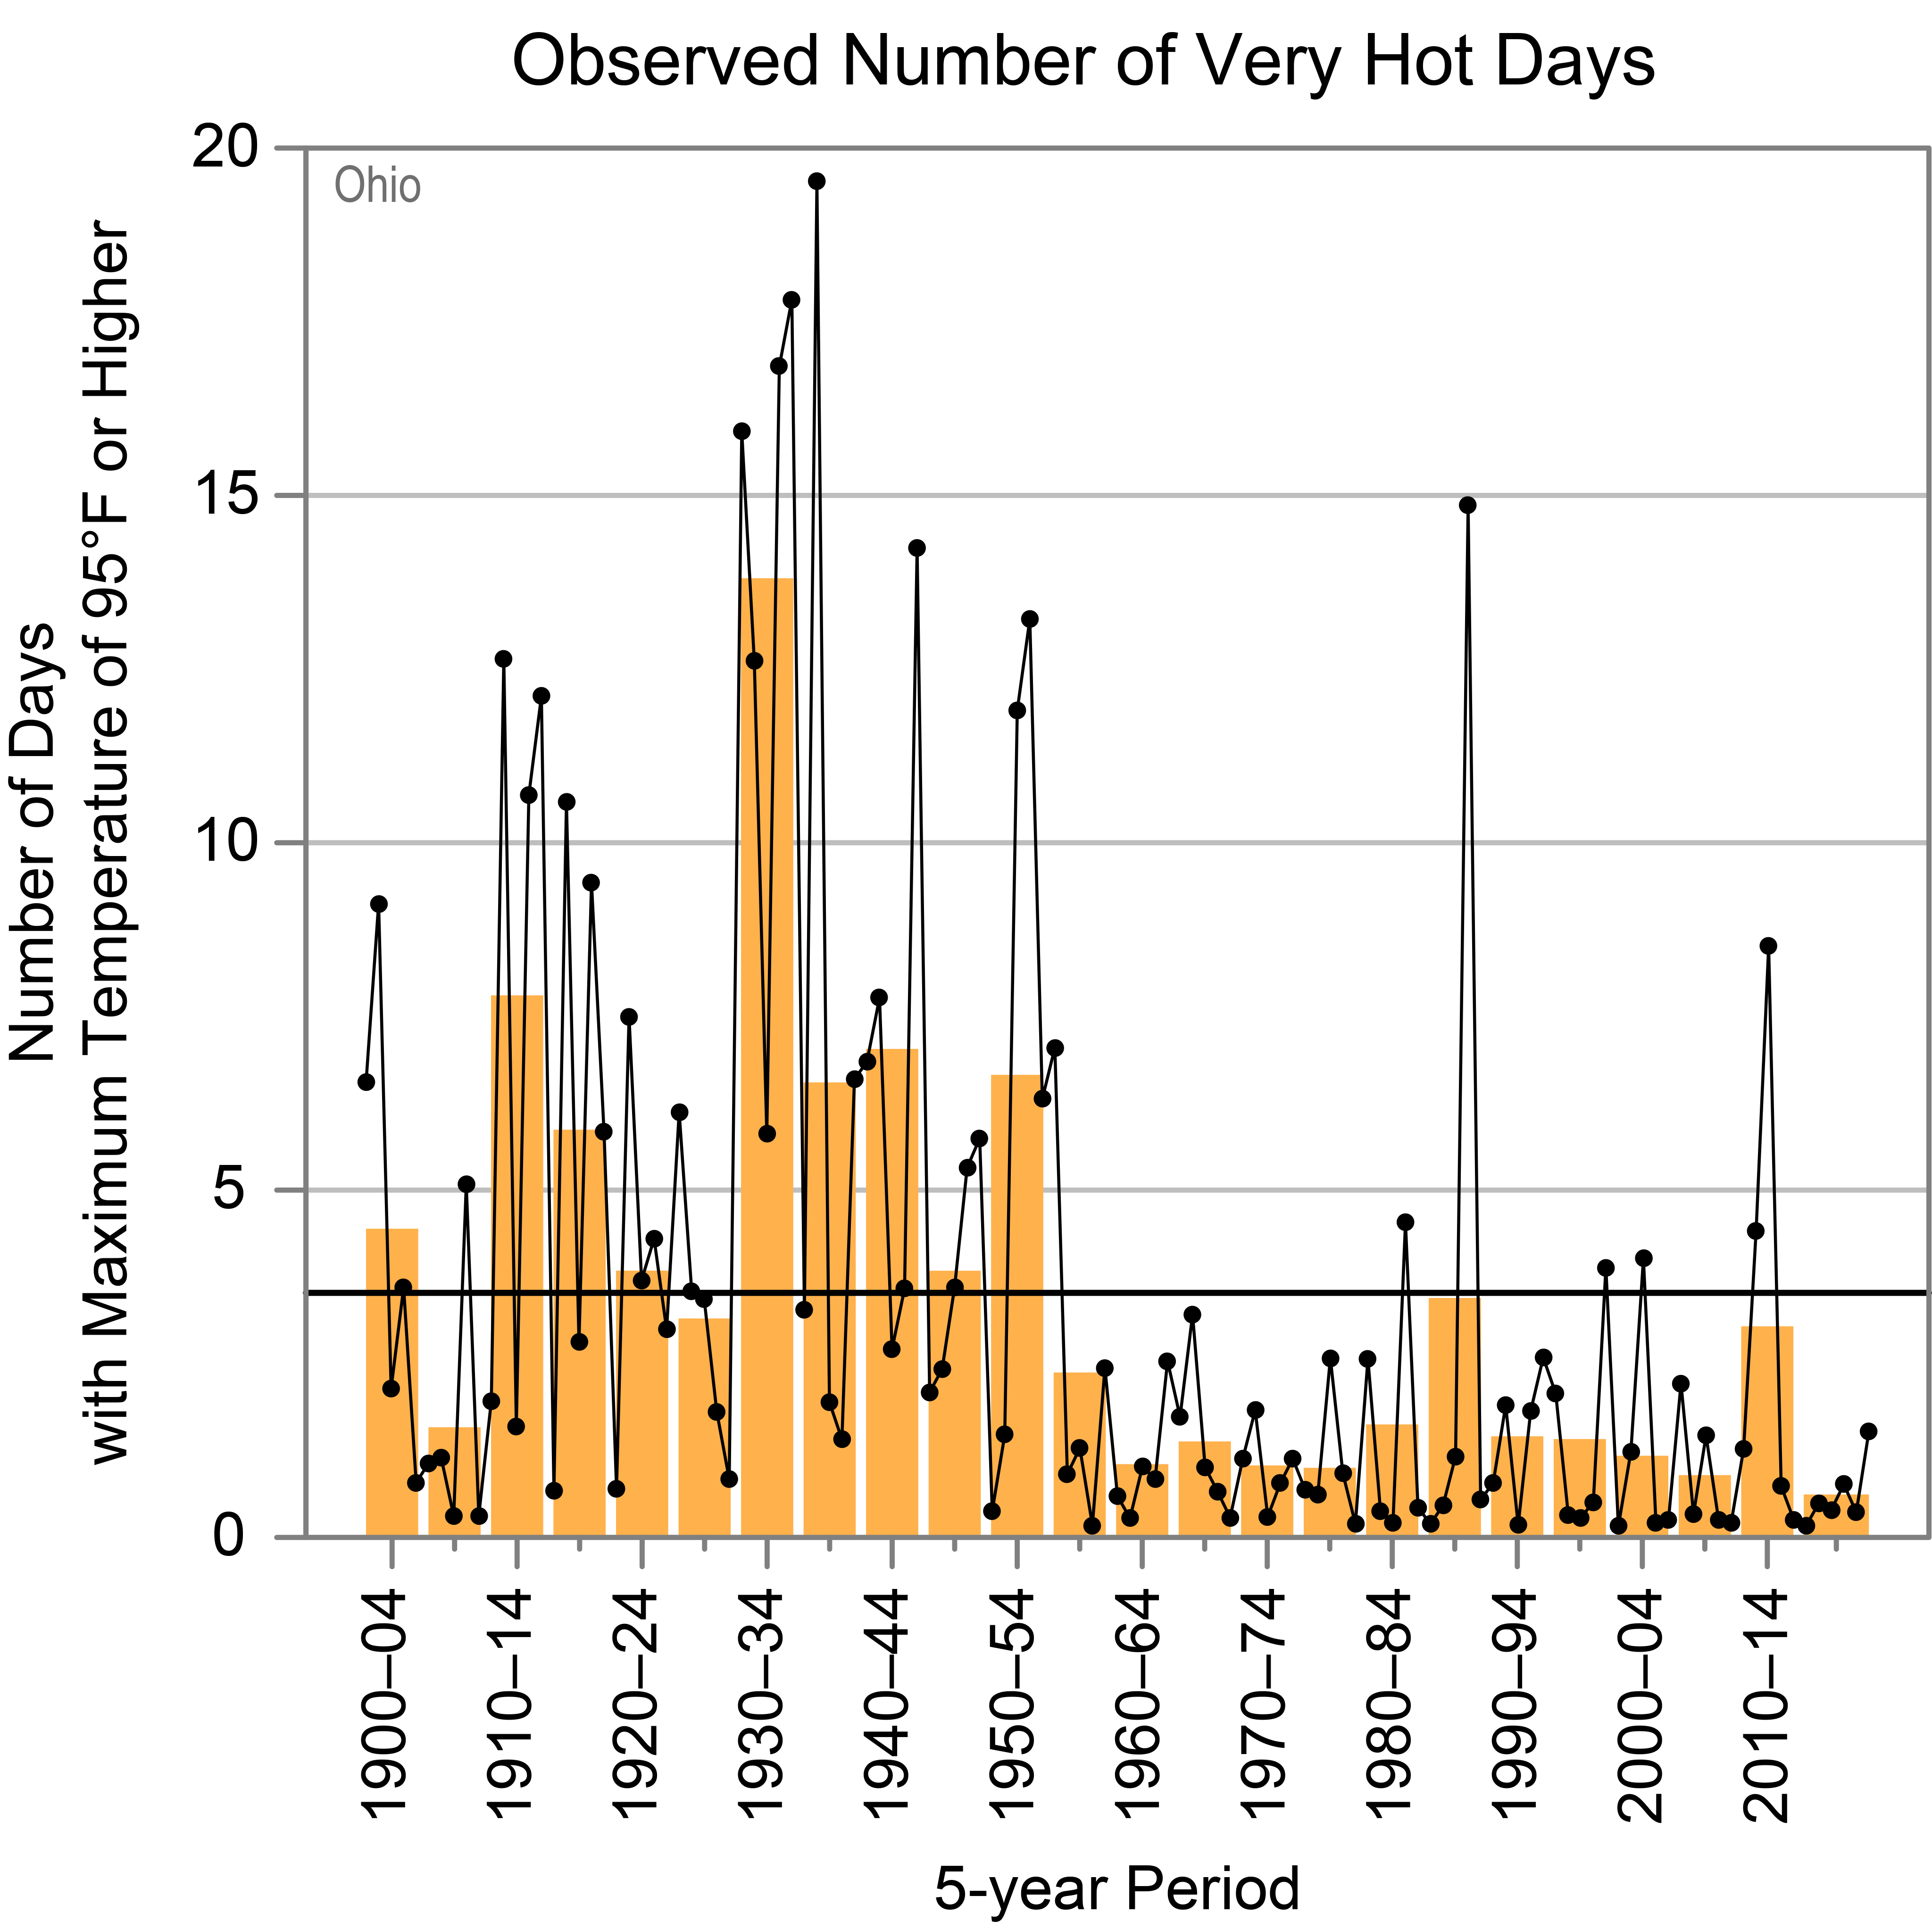
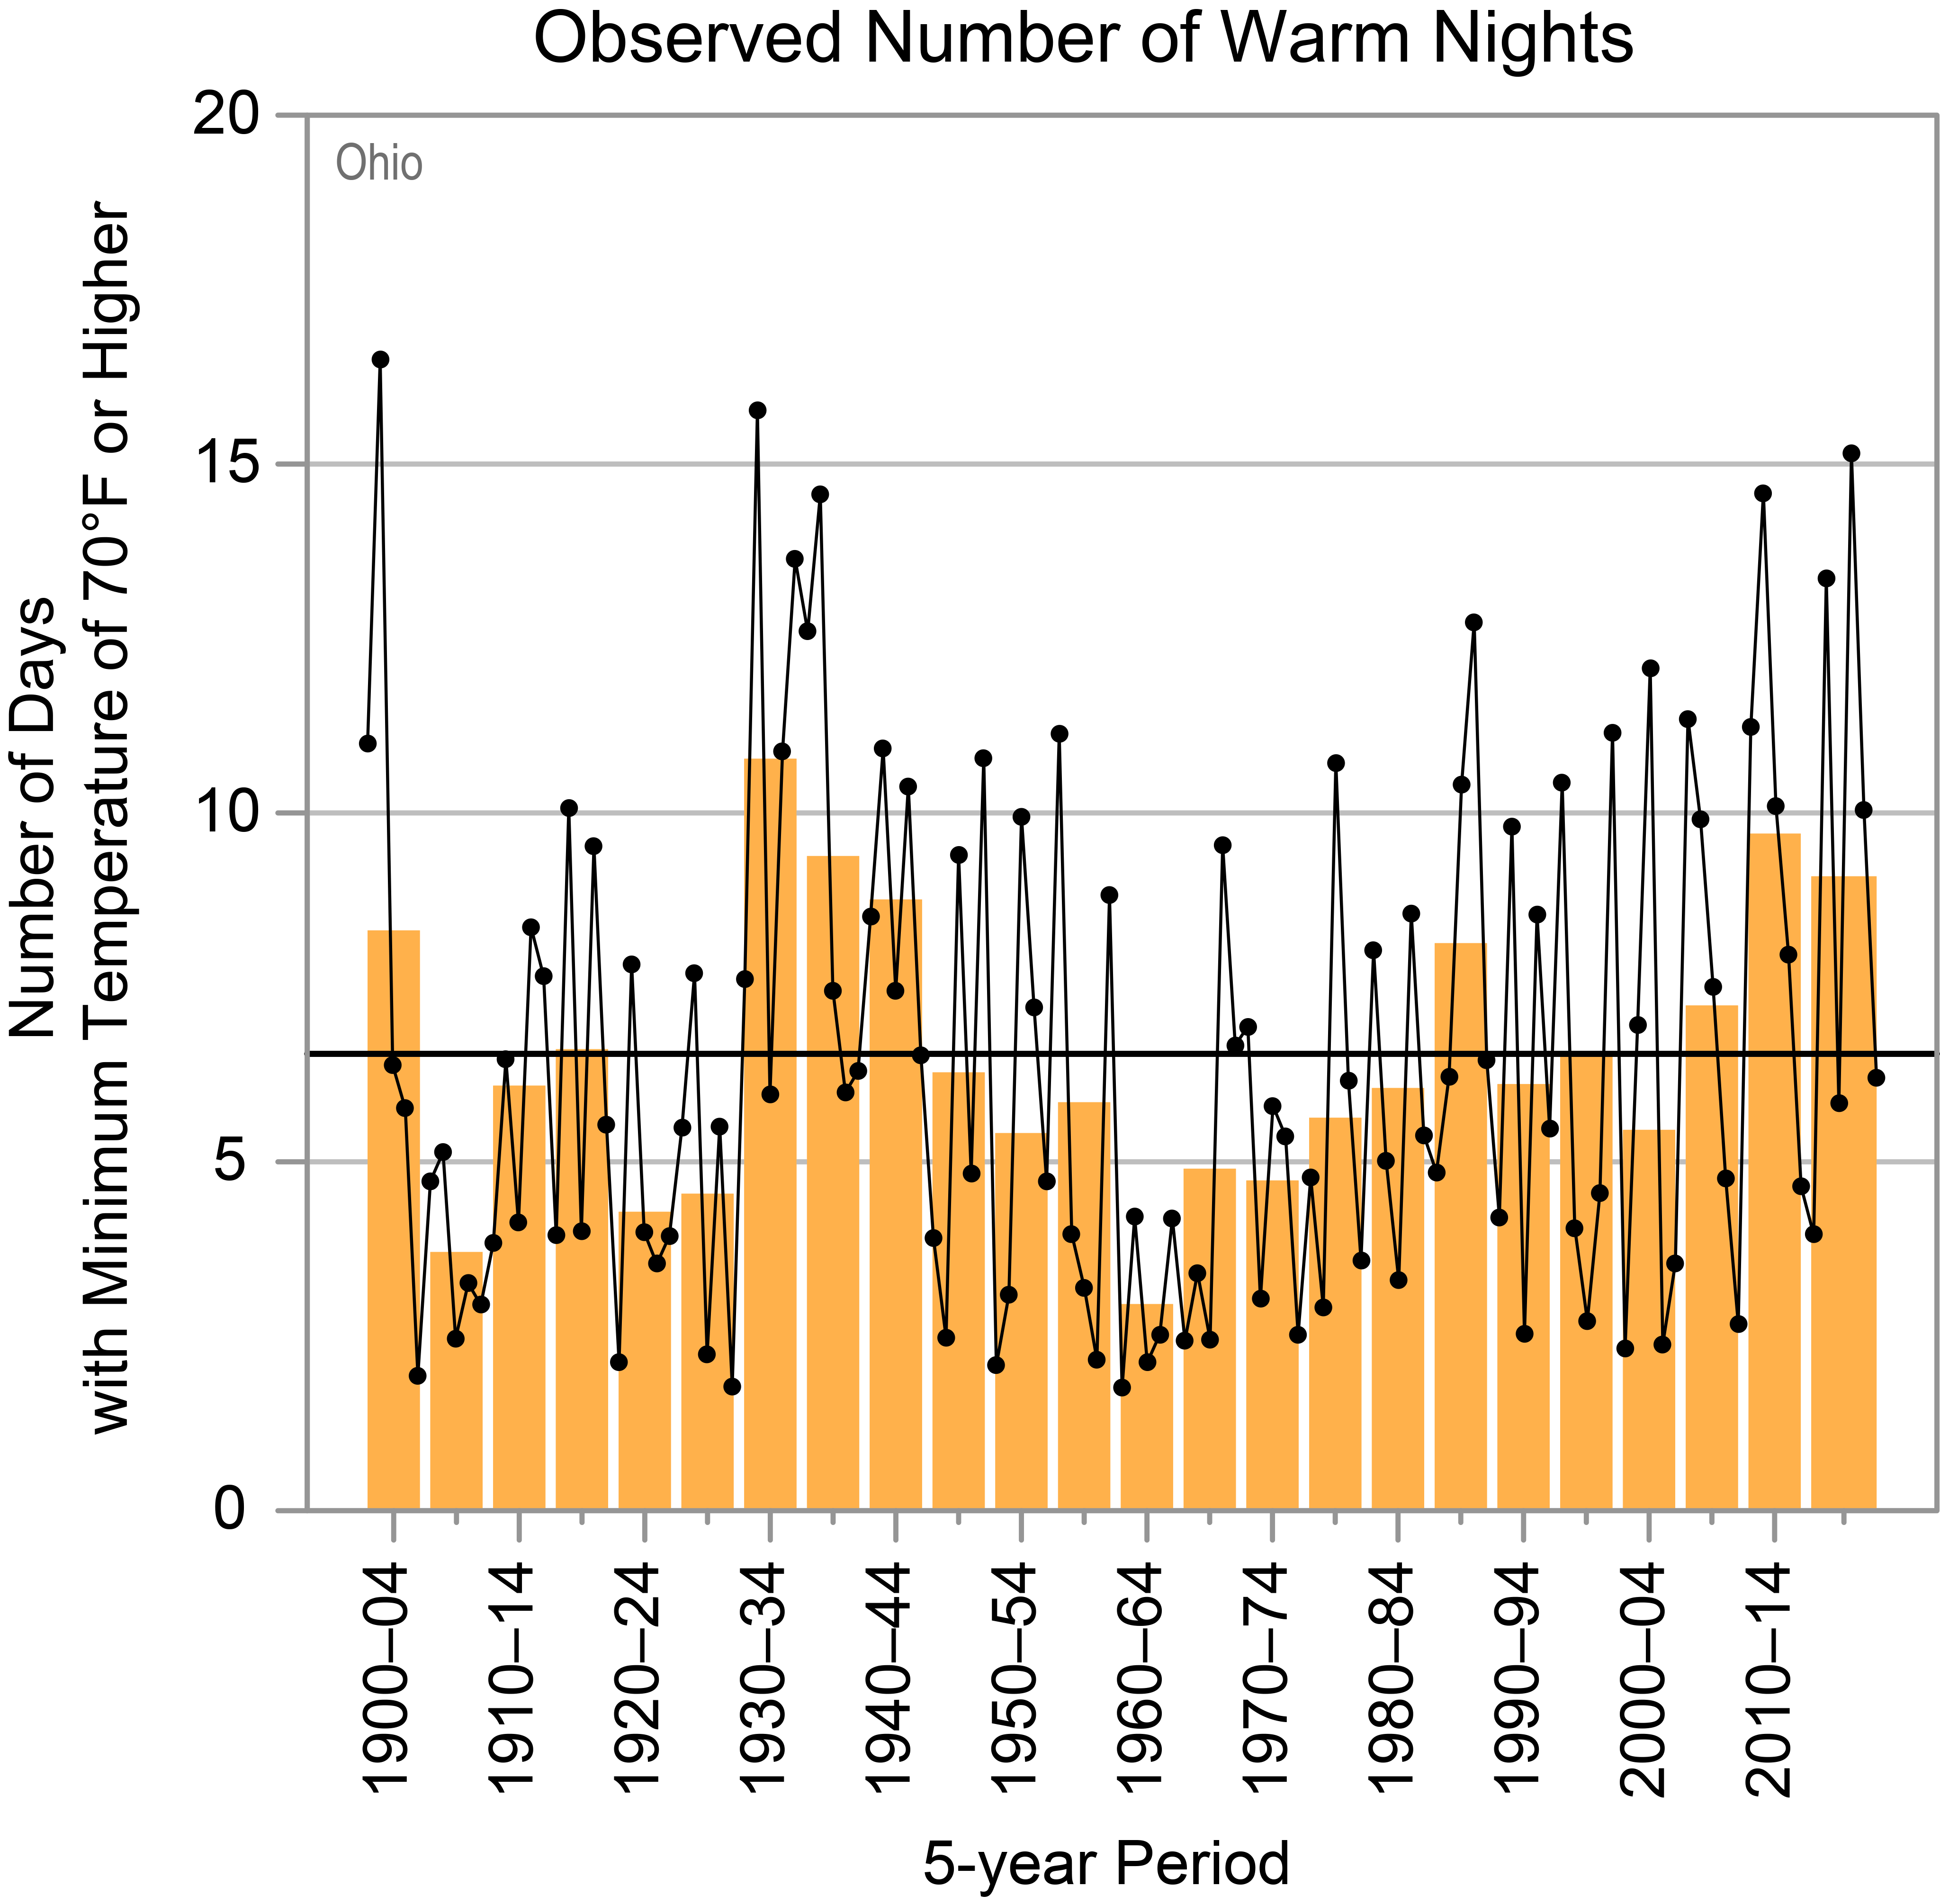
Since the beginning of the 20th century, temperatures in Ohio have risen more than 1.5°F, and temperatures in the 2000s and 2010s were warmer than in any other historical period (Figure 1). The warming has not been steady. The 1930s through the mid-1950s were generally above the long-term average but were followed by the coldest period on record: the 1960s and 1970s. Since the 1970s, annual average temperature has risen more than 2°F. Based on observations through 2020, 1998 was the hottest year on record, with an annual average temperature for the state of 54.1°F. The second hottest year was 2012, with an average temperature of 54.0°F. This warming has been concentrated in the winter and spring. Summer days have not warmed substantially in the state, a feature characteristic of much of the Midwest. This lack of summer warming is reflected in a below average occurrence of very hot days (Figure 2a). However, in addition to the overall higher summer average nighttime temperatures, the state has experienced an increase in the number of warm nights (Figure 3). Both Cleveland and Columbus have experienced statistically significant increases in the number of warm nights since 1950. Since 2000, Cleveland and Columbus have averaged 17 and 22 warm nights, respectively, per year, compared to an average of 8 and 9 nights, respectively, in the 1950s through 1970s. Although both cities also experienced a higher frequency of warm nights in the 1930s, this was mostly due to extreme high daytime temperatures. While Ohio generally experienced a near to below average number of very cold nights between 1990 and 2020, very high values occurred in 2014 and 2015, when the so-called “polar vortex” pattern dominated winter weather in the eastern U.S. (Figure 2b).
Figure 2
a)
b)

c)

d)

e)

Annual precipitation varies regionally, with the northwestern part of the state averaging 32 inches each year and the southern part of the state averaging 42 inches each year. Statewide total annual precipitation has ranged from a low of 26.8 inches in 1963 to a high of 56.0 inches in 2011. The driest multiyear periods were 1930–1934 and 1960–1964, and the wettest multiyear periods have occurred since 2000 (Figure 2c). Annual average precipitation during the driest and wettest consecutive 5 years has ranged from a low of 33.6 inches for the 1930–1934 period to a high of 43.3 inches for the 2015–2019 interval. Snowfall also varies across the state. The northern portion of the state along the southern shores of Lake Erie receives 60 inches or more annually, and the southern portion of the state receives less than 16 inches annually.
Ohio has experienced a significant increase in the number of 2-inch extreme precipitation events since the mid-1990s (Figure 4). Past episodes of heavy rains have caused severe flooding in the state. The Great Flood of 1913 was one of the deadliest floods in U.S. history and Ohio’s greatest weather disaster. From March 23 to 26, heavy rains caused extreme runoff from soils saturated from winter storms. Levees along the Great Miami River failed, flooding the entire Great Miami River watershed. Downtown Dayton was hit particularly hard, with floodwaters reaching depths of 20 feet. The flooding caused more than $2 billion in damages, and more than 400 people died. One of the worst floods in recent decades occurred in March 1997. Between March 1 and 3, 6–12 inches of rain fell in parts of southern Ohio, causing serious flooding, particularly along Brush Creek and the Scioto and Great Miami Rivers. Levels on the main stem of the Ohio River were the highest in more than 30 years. Seventeen counties were declared federal disaster areas, and more than 5,000 homes were damaged or destroyed, resulting in almost $300 million in damages.
Dangerous storms can occur in every season and can cause major impacts, including loss of life, property damage, and disruptions to economic activity. Winter can bring snowstorms and ice storms, while convective storms (including thunderstorms, flood-producing rainstorms, hail, and tornadoes) are common in the warmer months. Although Ohio does not experience as many tornadoes as other states in the Midwest and Great Plains, the state has experienced several deadly tornado outbreaks. On June 28, 1924, Ohio’s deadliest tornado struck the towns of Sandusky and Lorain, killing 85 people and causing more than a billion dollars in damages. Other notable storms include the Palm Sunday Outbreak on April 11, 1965, which produced 10 tornadoes in the state (4 of which were F4 intensity) and caused 60 deaths; the Xenia tornado (F5 intensity) in the Super Outbreak of 1974 that killed 34 people; and the outbreak of April 8–9, 1999, which produced 54 tornadoes, including an F4 intensity tornado in Blue Ash and Montgomery that killed 4 people.

Agriculture is an important component of Ohio’s economy, and this sector is particularly vulnerable to extreme weather conditions. In 2007, unusually warm March temperatures were followed by a hard freeze in April, which devastated much of the state’s apple crop. This scenario was again observed in 2012, when March temperatures were 9° to 15°F above average for the state but a cool April followed, with hard freezes. Seasonal precipitation can vary, with no real trend in winter or summer precipitation (Figures 2d and 2e). In 2012, an intense drought throughout the Midwest had severe impacts on Ohio. Rainfall totals for the summer were several inches below average. In addition to low precipitation, the period from January to June was the warmest in 120 years of record, with the warm temperatures compounding the dry conditions. By the end of the year, 86 of Ohio’s 88 counties had been declared drought disaster areas.
Under a higher emissions pathway, historically unprecedented warming is projected to continue through this century (Figure 1). Even under a lower emissions pathway, annual average temperatures are projected to most likely exceed historical record levels by the middle of this century. However, a large range of temperature increases is projected under both pathways, and under the lower pathway, a few projections are only slightly warmer than historical records. Increases in extreme heat are a particular concern for Cincinnati, Columbus, and other urban areas, where the urban heat island effect raises summer temperatures. High temperatures combined with high humidity can create dangerous heat index values. From July 17 to 24, 2011, the Ohio River Valley experienced a prolonged heat wave. With temperatures above 90°F for several days in a row and dewpoints in the mid to upper 70s (°F), heat index values rose to between 100° and 110°F during the day. These occurrences are likely to become more common as temperatures continue to rise. However, there have been exceptionally cold winters in recent years. During the winters of 2013–2014 and 2014–2015, persistent weather patterns brought frigid air southward from the Arctic, causing temperatures from December to February to be more than 3°F below average. Although the state averages approximately 6 very cold nights annually, these two winters averaged 18 very cold nights. The intensity of such events is projected to decrease in the future.
Although annual precipitation projections are uncertain, winter and spring precipitation is projected to increase (Figure 5). In addition, extreme precipitation is projected to increase, potentially causing more frequent and intense floods. Heavier precipitation and higher temperatures increase the risk of springtime flooding, posing a threat to Ohio’s agricultural industry by delaying planting and resulting in a loss of yield.
The intensity of future droughts is projected to increase. Even if precipitation increases in the future, rising temperatures will increase the rate of loss of soil moisture during dry spells. Thus, future summer droughts, a natural part of the Ohio climate, are likely to be more intense.

Details on observations and projections are available on the Technical Details and Additional Information page.
RESOURCES
- Austin, G., K. Rizzo, A. Matte, and B. Finnerty, 1998: Service Assessment: Ohio River Valley Flood of March 1997. National Oceanic and Atmospheric Administration, National Weather Service, Office of Hydrology, Silver Spring, MD, 35 pp. https://repository.library.noaa.gov/view/noaa/6398
- Brooks, H.E. and C.A. Doswell, 2001: Normalized damage from major tornadoes in the United States: 1890–1999. Weather and Forecasting, 16 (1), 168–176. http://dx.doi.org/10.1175/1520-0434(2001)016%3C0168:NDFMTI%3E2.0.CO;2
- Hayhoe, K., D.J. Wuebbles, D.R. Easterling, D.W. Fahey, S. Doherty, J. Kossin, W. Sweet, R. Vose, and M. Wehner, 2018: Our changing climate. In: Impacts, Risks, and Adaptation in the United States: Fourth National Climate Assessment, Volume II. Reidmiller, D.R., C.W. Avery, D.R. Easterling, K.E. Kunkel, K.L.M. Lewis, T.K. Maycock, and B.C. Stewart, Eds. U.S. Global Change Research Program, Washington, DC, 72–144. https://nca2018.globalchange.gov/chapter/2/
- Jackson, K.S. and S.A. Vivian, 1997: Flood of March 1997 in Southern Ohio. Water-Resources Investigations Report 97-4149. Prepared in cooperation with the Ohio Department of Natural Resources, U.S. Geological Survey, Branch of Information Services, Denver, CO, 25 pp. https://pubs.usgs.gov/wri/1997/4149/report.pdf
- Kunkel, K.E., L.E. Stevens, S.E. Stevens, L. Sun, E. Janssen, D. Wuebbles, S.D. Hilberg, M.S. Timlin, L. Stoecker, N.E. Westcott, and J.G. Dobson, 2013: Regional Climate Trends and Scenarios for the U.S. National Climate Assessment Part 3. Climate of the Midwest U.S. NOAA Technical Report NESDIS 142-3. National Oceanic and Atmospheric Administration, National Environmental Satellite, Data, and Information Service, Silver Spring, MD, 103 pp. https://nesdis-prod.s3.amazonaws.com/migrated/NOAA_NESDIS_Tech_Report_142-3-Climate_of_the_Midwest_US.pdf
- MCD, n.d.: The Great Flood of 1913. Miami Conservancy District, Dayton, OH. https://www.mcdwater.org/about-mcd-2/the-history-of-mcd/the-great-flood-of-1913/
- MRCC, 2013: The Great Flood of 1913: 100 Years Later. Midwestern Regional Climate Center, Urbana-Champaign, IL. https://mrcc.illinois.edu/1913Flood/storms_wx/rivers.shtml
- MRCC, n.d.: cli-MATE: MRCC Application Tools Environment. Midwestern Regional Climate Center, Urbana-Champaign, IL. https://mrcc.illinois.edu/CLIMATE/
- NOAA and USDA, 2007: The Easter Freeze of April 2007: A Climatological Perspective and Assessment of Impacts and Services. Technical Report 2008-01. National Oceanic and Atmospheric Administration and the U.S. Department of Agriculture, Silver Spring, MD, 56 pp. https://www1.ncdc.noaa.gov/pub/data/techrpts/tr200801/tech-report-200801.pdf
- NOAA NCDC, n.d.: Climate of Ohio. National Oceanic and Atmospheric Administration, National Climatic Data Center, Asheville, NC, 10 pp. https://www.ncei.noaa.gov/data/climate-normals-deprecated/access/clim60/states/Clim_OH_01.pdf
- NOAA NCEI, n.d.: Climate at a Glance: Statewide Time Series, Ohio. National Oceanic and Atmospheric Administration, National Centers for Environmental Information, Asheville, NC, accessed June 8, 2021. https://www.ncdc.noaa.gov/cag/statewide/time-series/33/
- NOAA NWS, n.d.: April 11th 1965 Palm Sunday Tornado Outbreak. National Oceanic and Atmospheric Administration, National Weather Service, Northern Indiana Weather Forecast Office, Syracuse, IN. https://www.weather.gov/iwx/1965_palmsunday_50
- NOAA NWS, n.d.: The Super Outbreak of April 3–4, 1974. National Oceanic and Atmospheric Administration, National Weather Service, Wilmington Weather Forecast Office, Wilmington, OH. https://www.weather.gov/iln/19740403
- USDA FSA, 2014: Secretarial Disaster Designations—CY 2012: Primary and Contiguous Counties Designated for 2012 All Crop Disaster Losses. U.S. Department of Agriculture, Farm Service Agency, Washington, DC. https://www.fsa.usda.gov/Internet/FSA_File/disaster_map_cropyr_2012.pdf
- Vose, R.S., D.R. Easterling, K.E. Kunkel, A.N. LeGrande, and M.F. Wehner, 2017: Temperature changes in the United States. In: Climate Science Special Report: Fourth National Climate Assessment, Volume I. Wuebbles, D.J., D.W. Fahey, K.A. Hibbard, D.J. Dokken, B.C. Stewart, and T.K. Maycock, Eds. U.S. Global Change Research Program, Washington, DC, 185–206. http://doi.org/10.7930/J0N29V45