PENNSYLVANIA
Pennsylvania has a diverse landscape of mountains, agricultural regions, and large metropolitan areas. The Appalachian Mountains cut across the center of the state, with the Piedmont and Coastal Plain to the east and the Allegheny Plateau and Lake Erie lowlands to the west. The state is bordered by Lake Erie to the northwest and the Delaware River and Delaware Estuary to the east. The state’s climate is heavily influenced by several geographic features. The Atlantic Ocean has a moderating effect on coastal areas, while Lake Erie moderates the northwestern part of the state. During much of the year, the prevailing westerly flow brings air masses from the North American interior across the entire region, with occasional episodes of bitter cold during winter. The jet stream, which is often located near or over the region during winter, brings frequent storm systems, causing cloudy skies, windy conditions, and precipitation. Pennsylvania is affected by a number of extreme weather events, including floods, tropical cyclones, heat and cold waves, severe thunderstorms, snow and ice storms, and nor’easters.
Figure 1
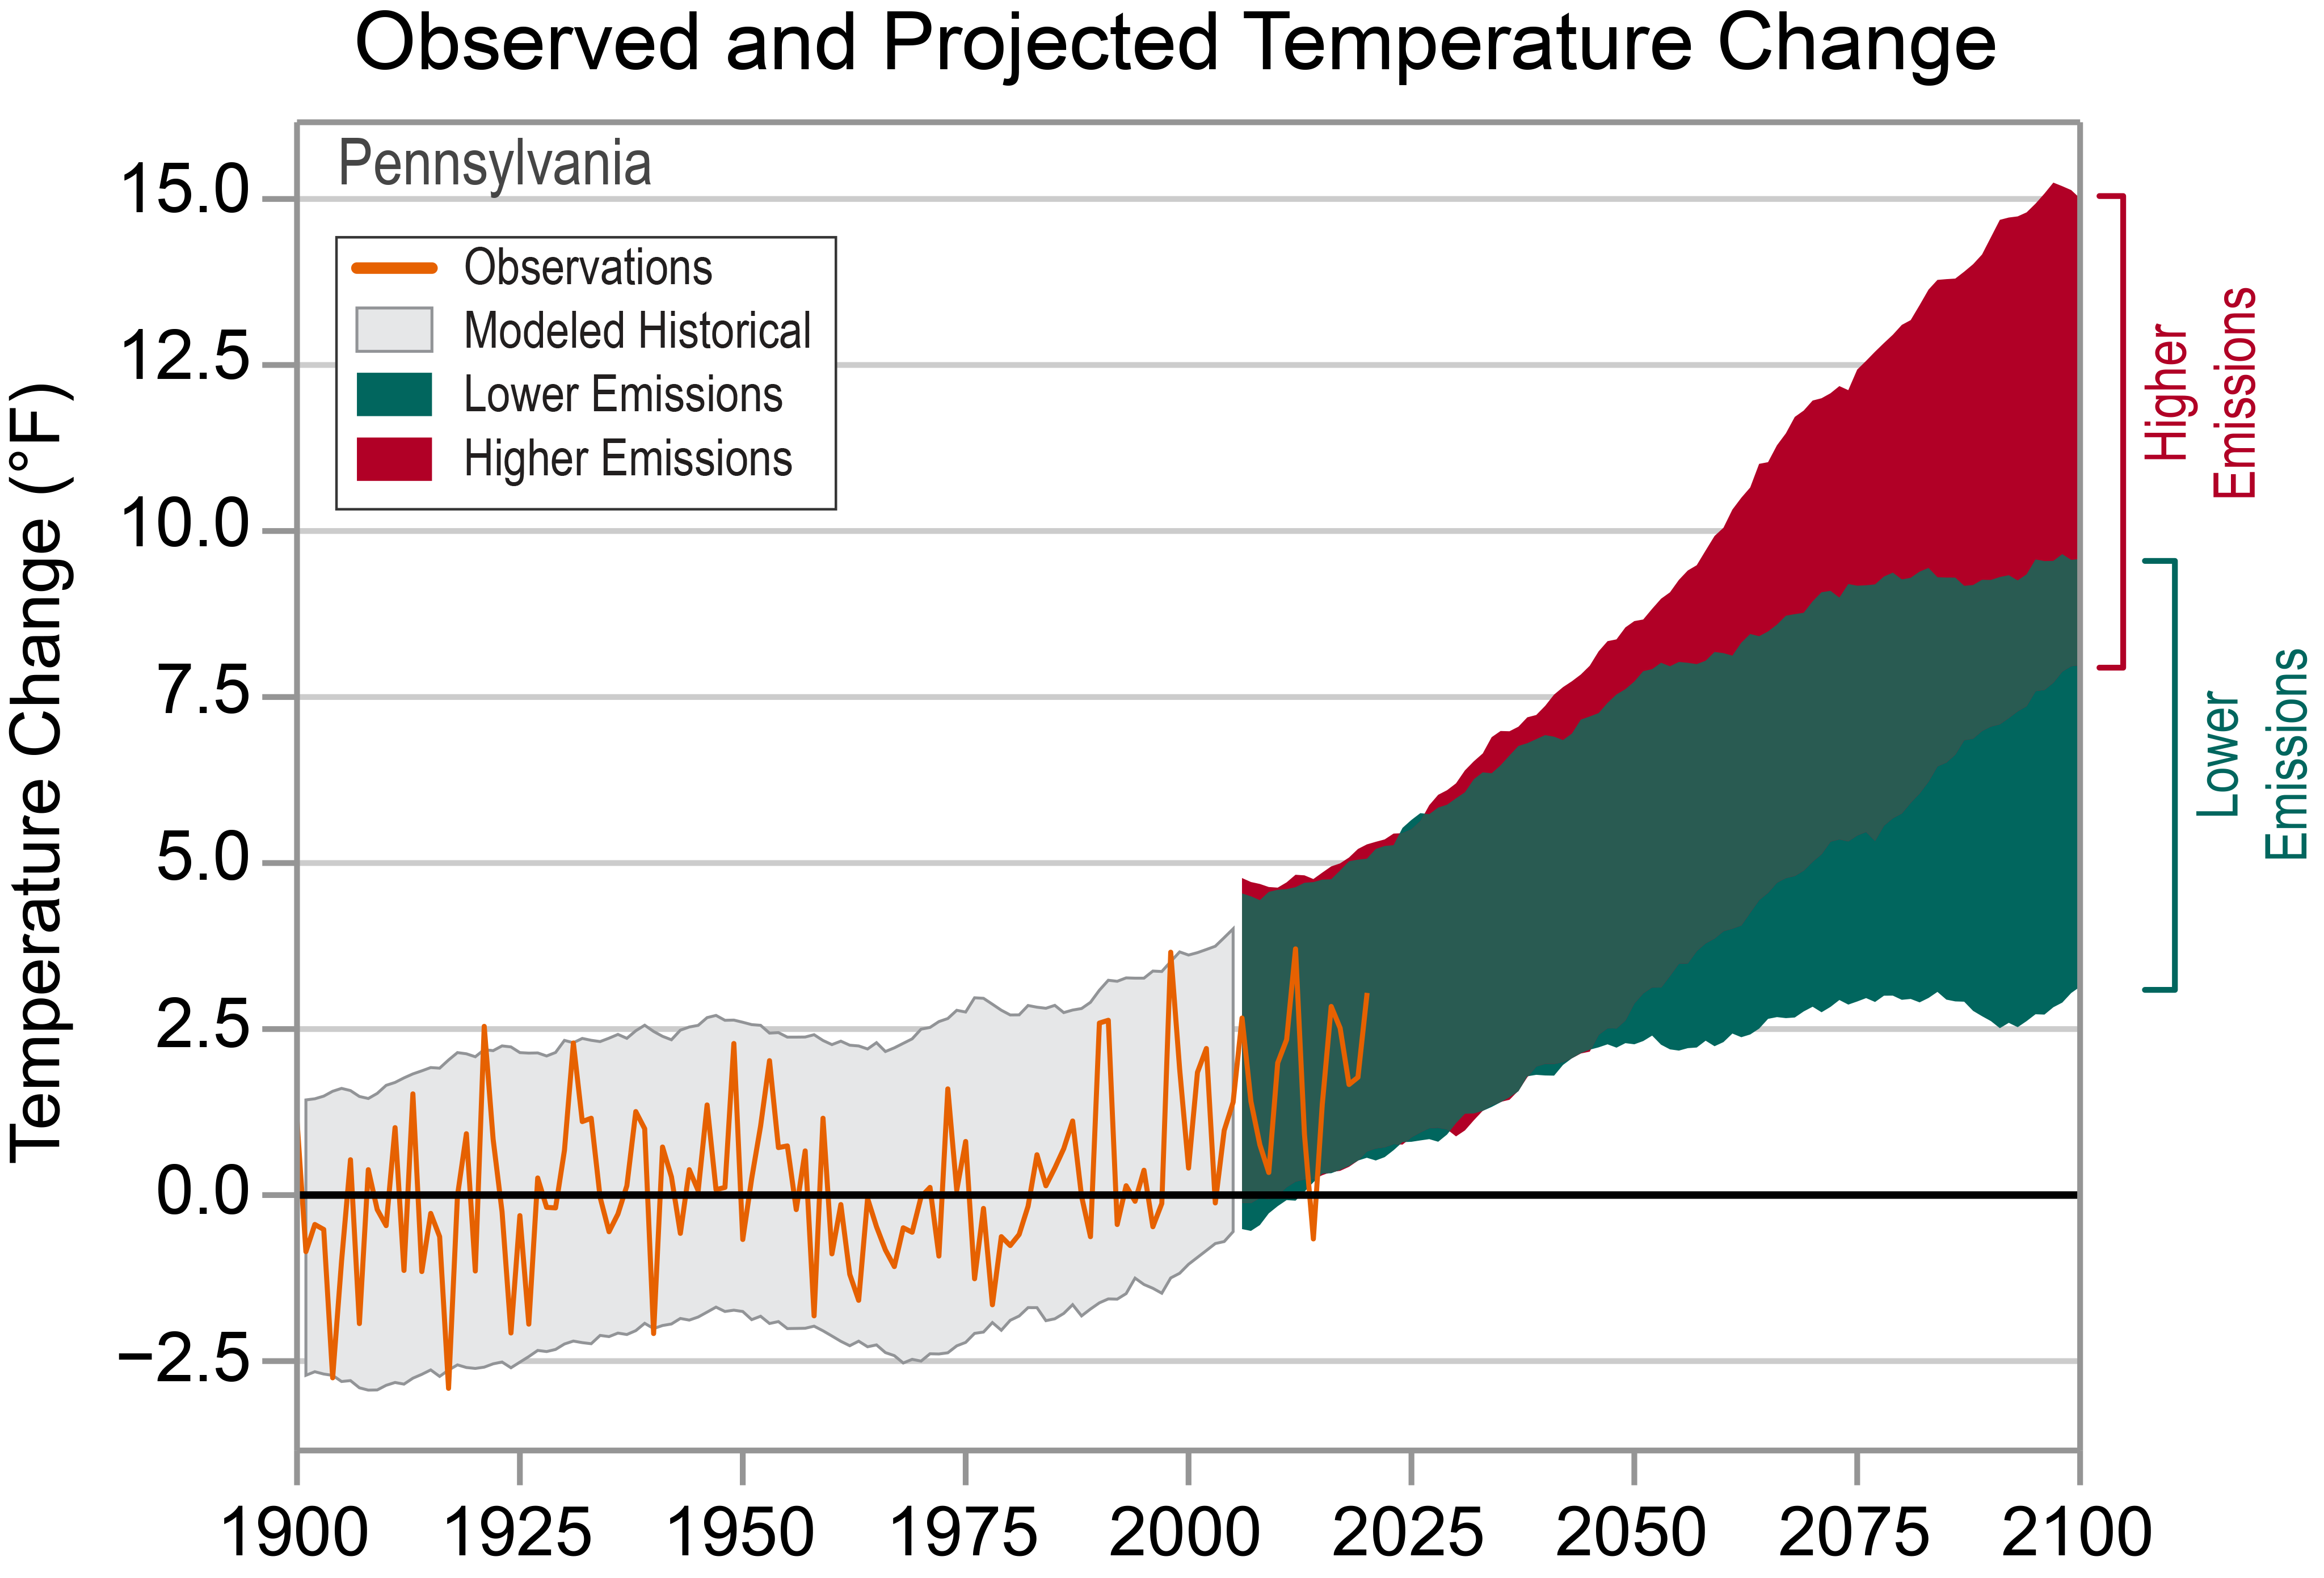
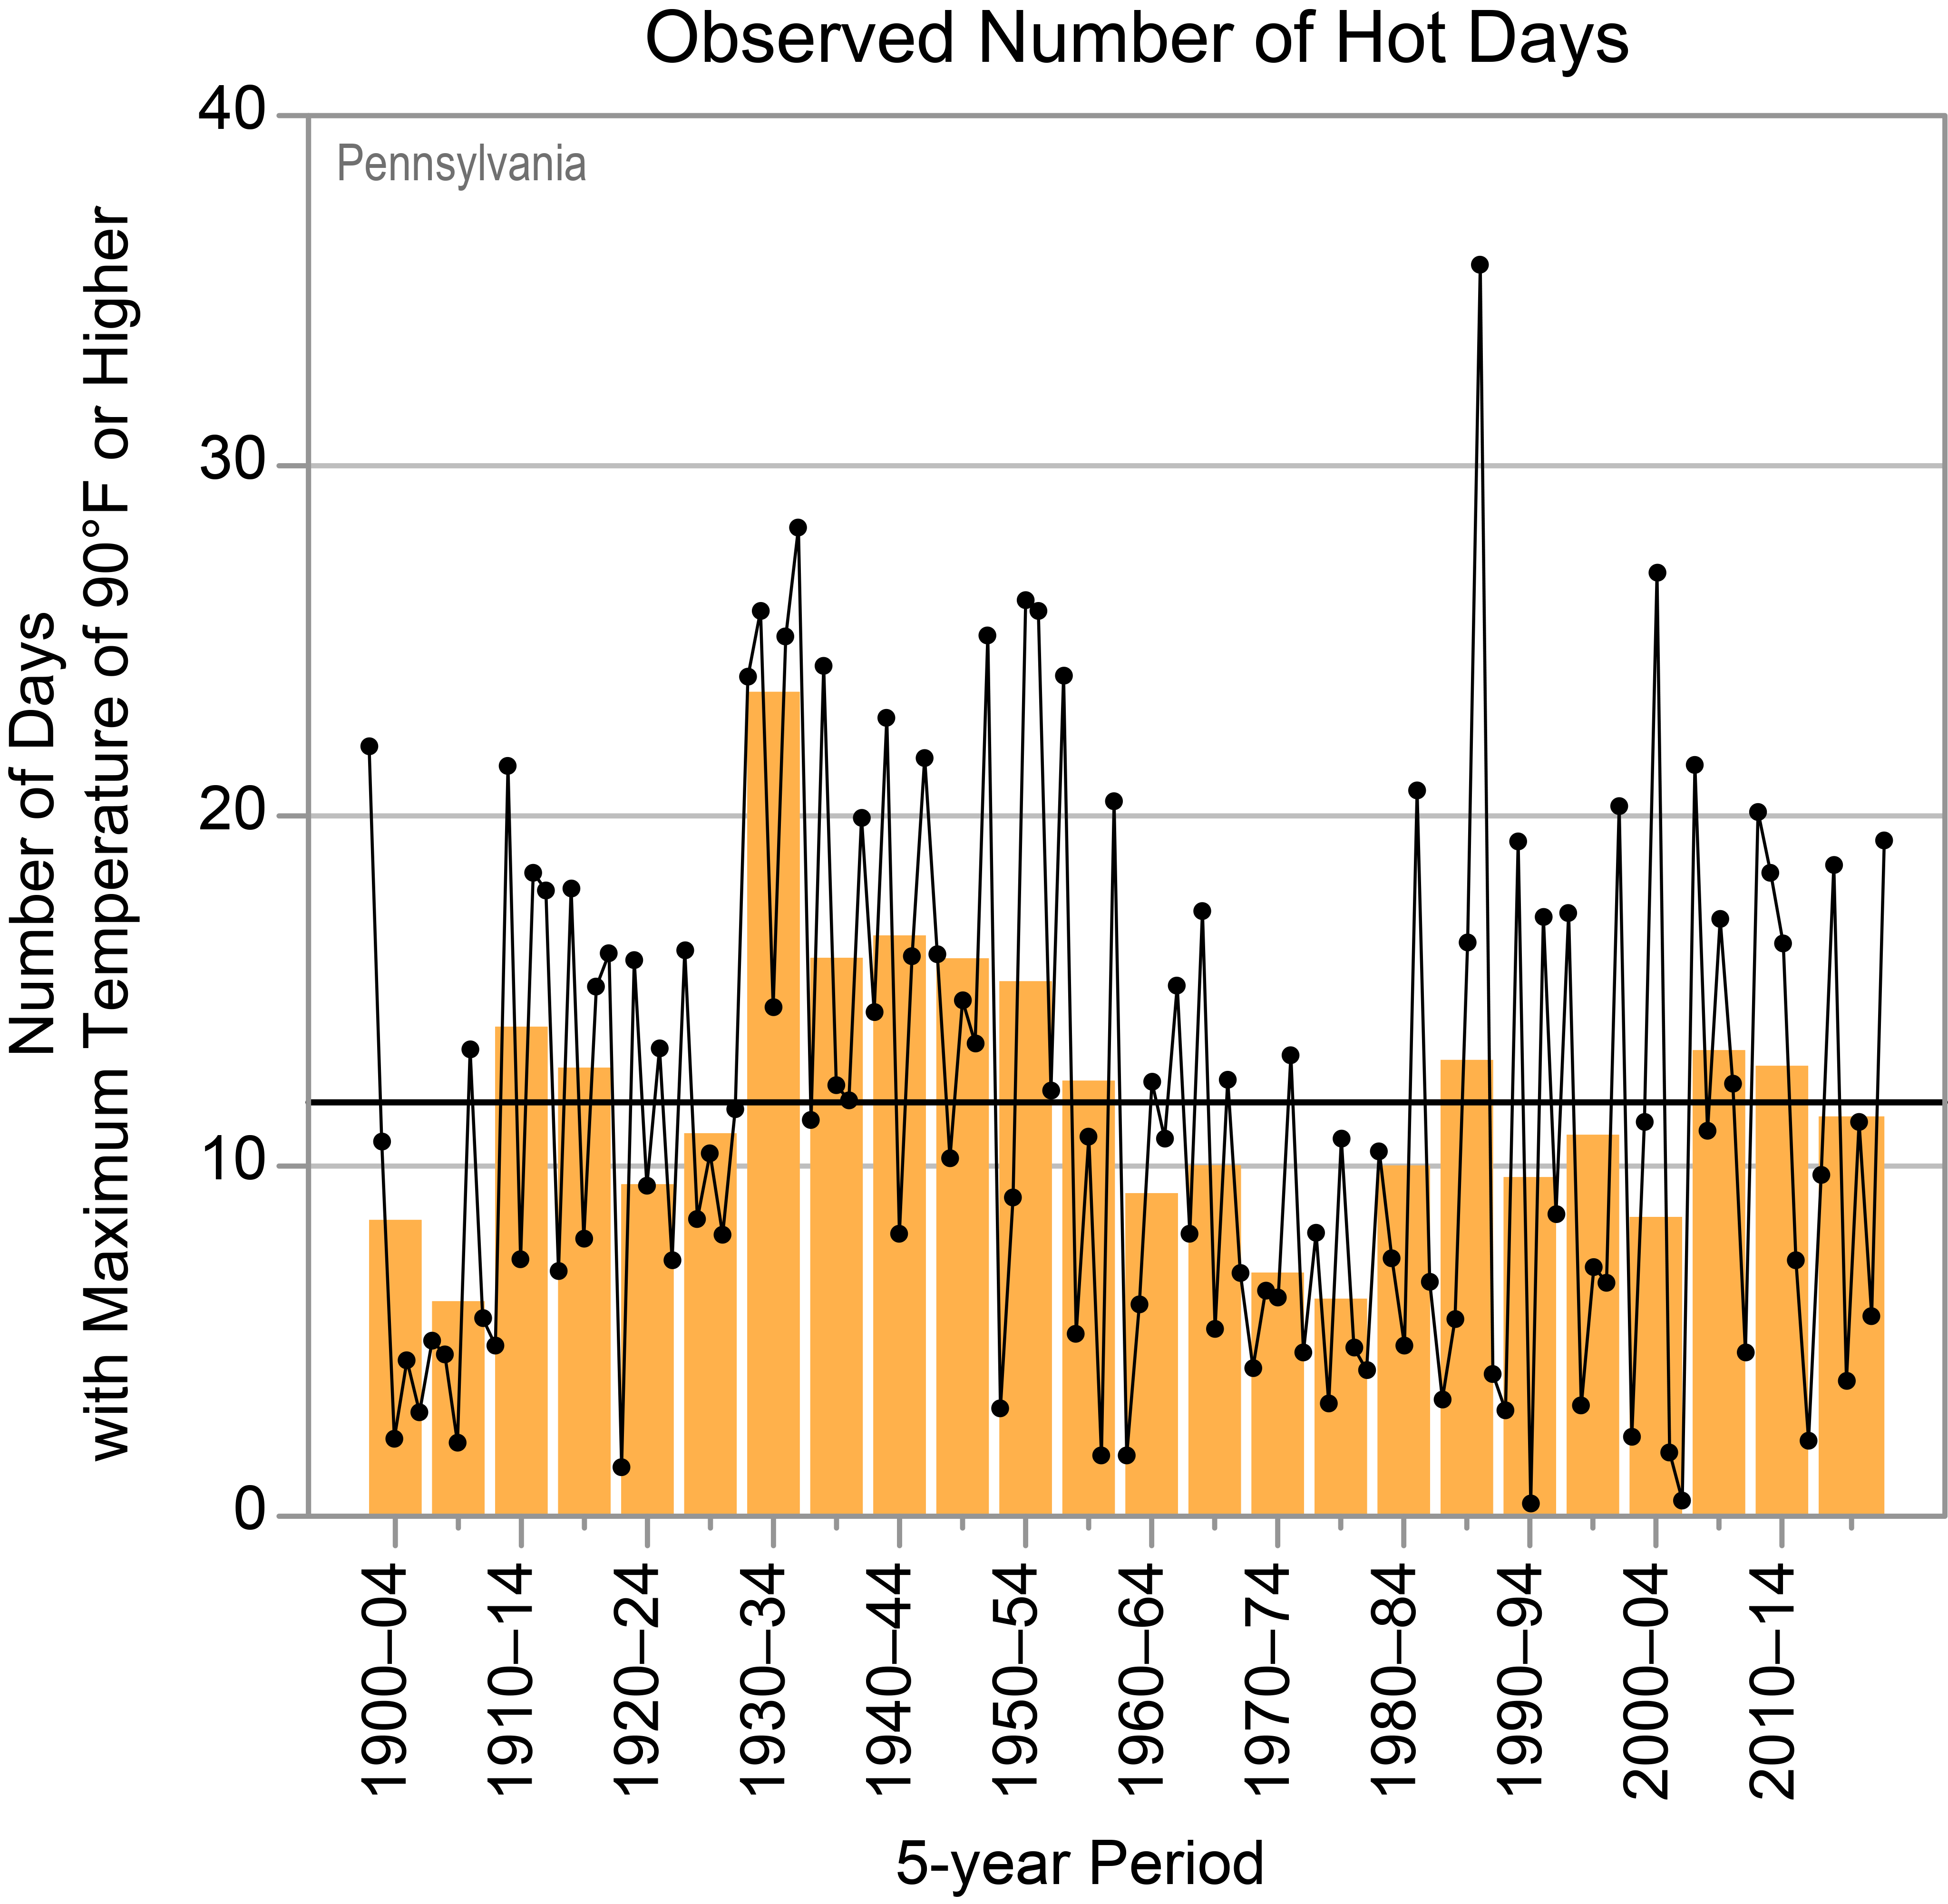
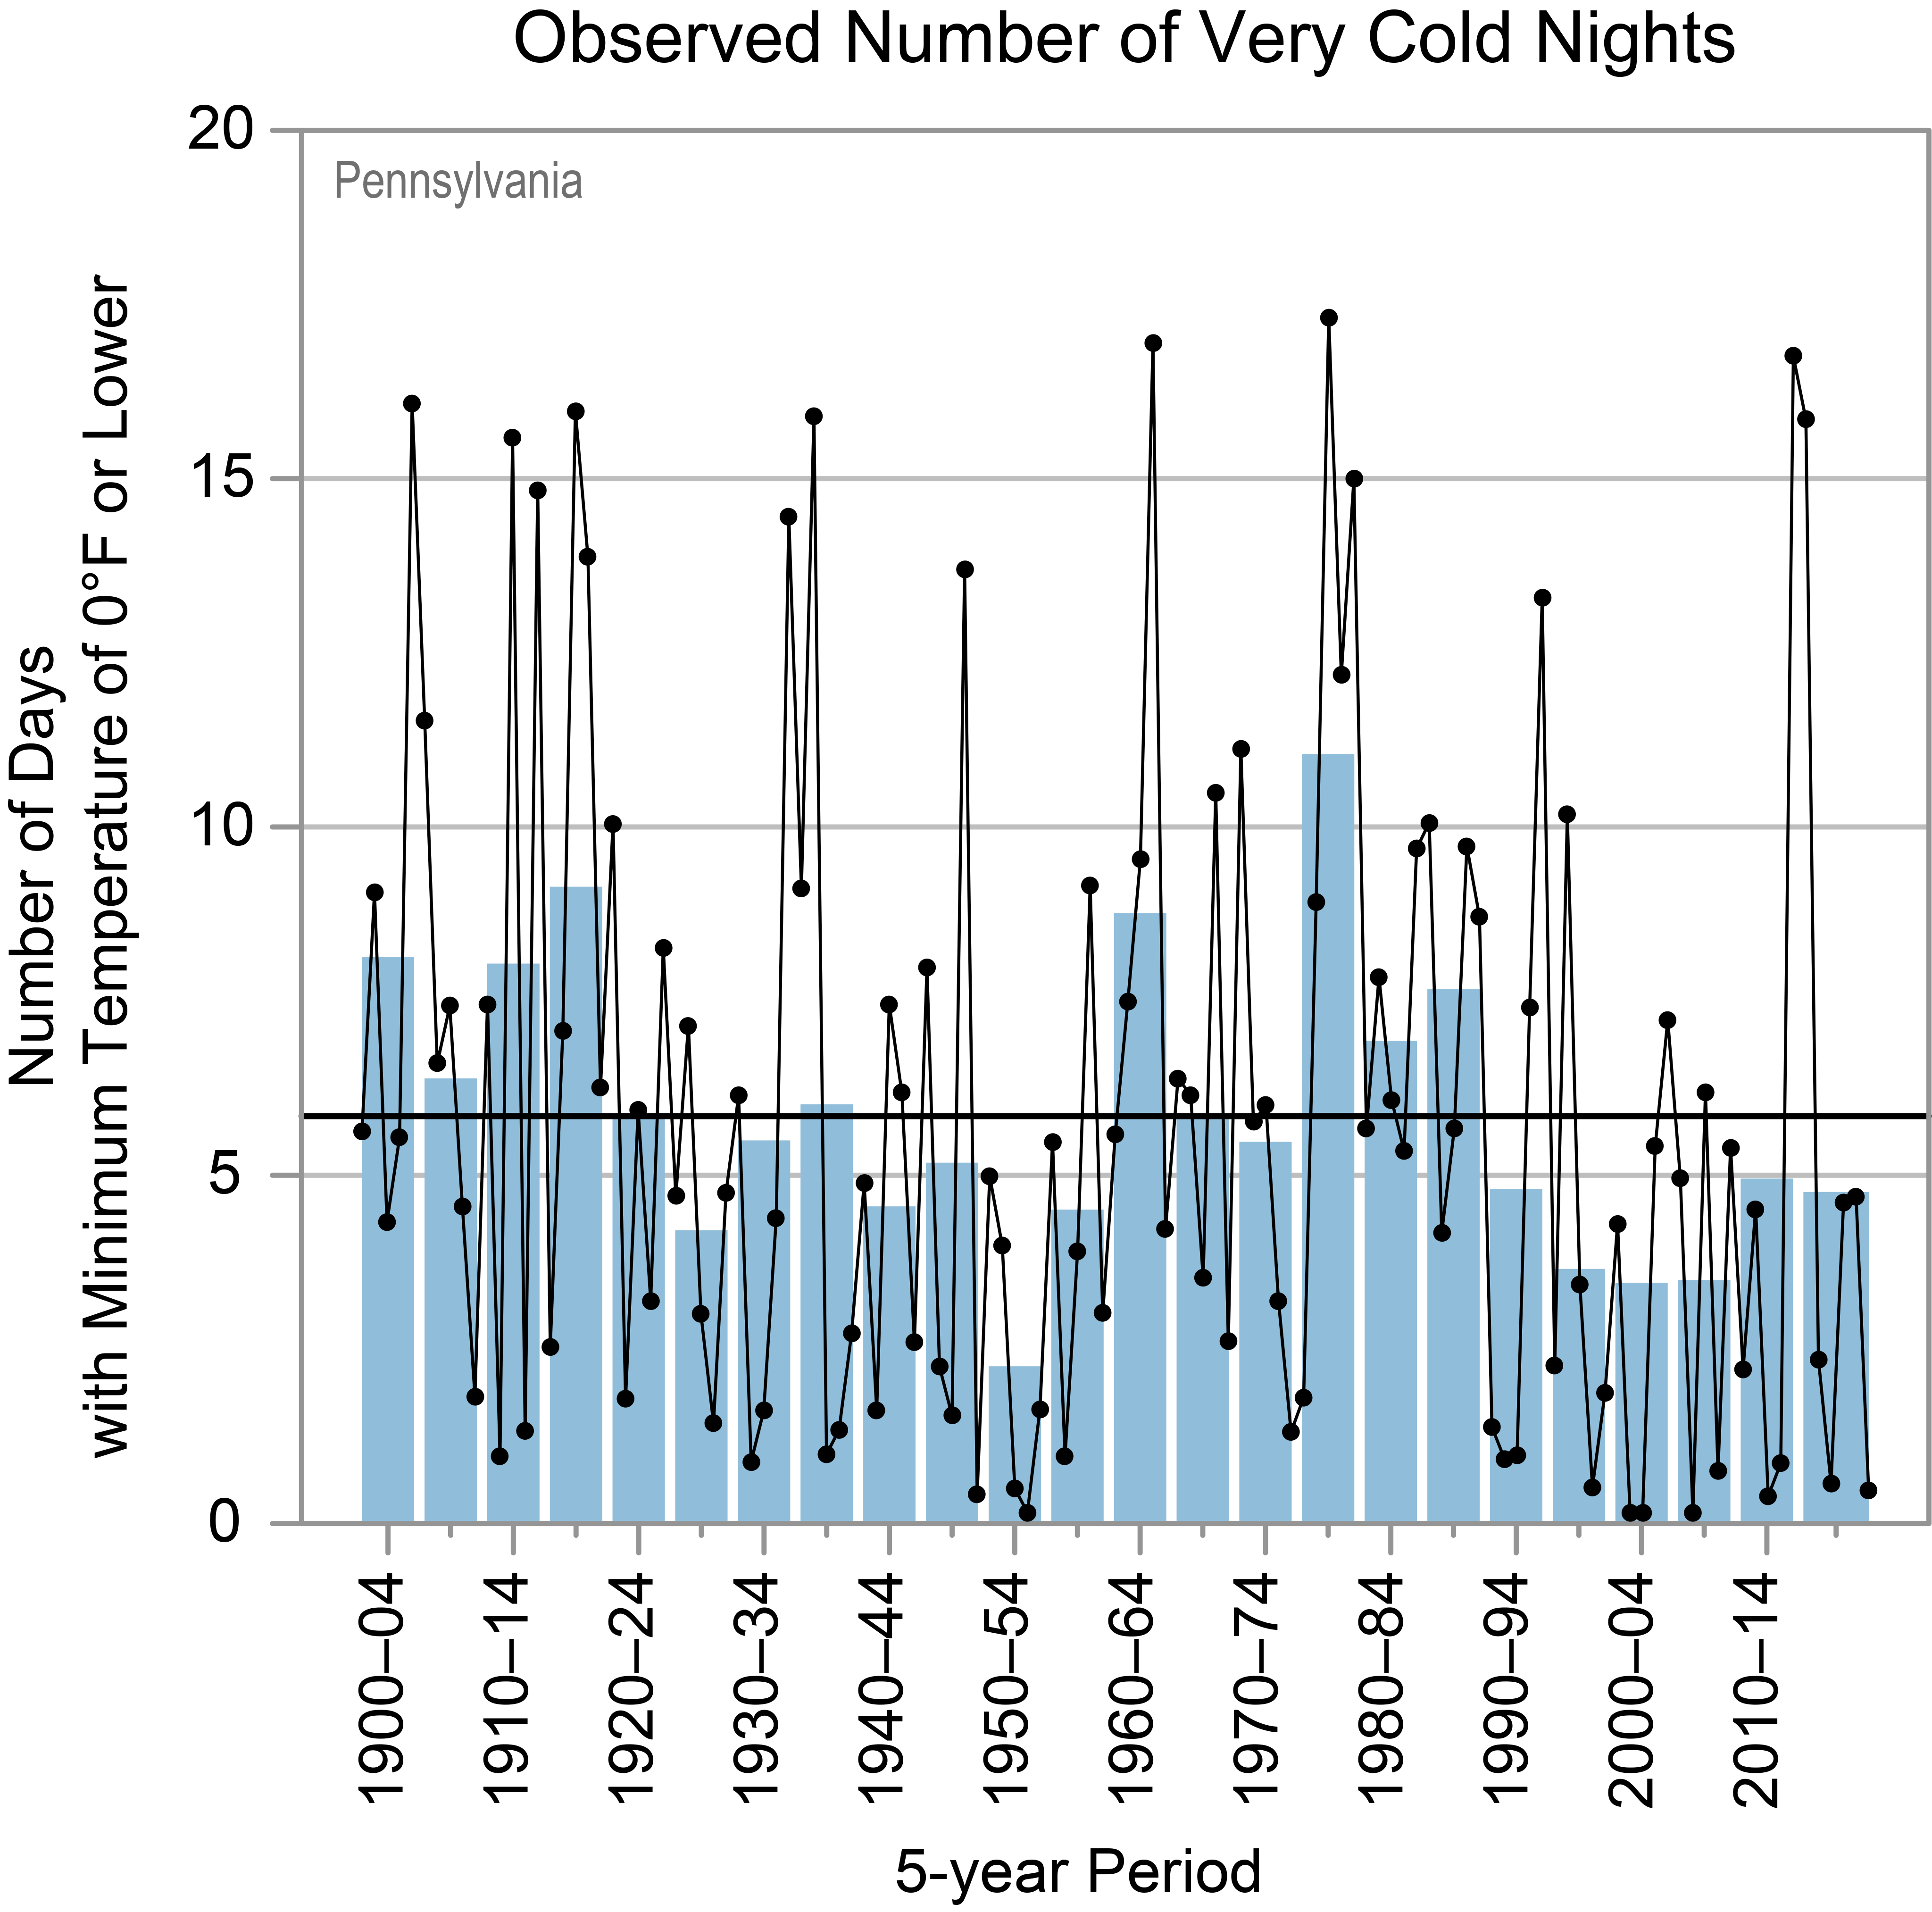
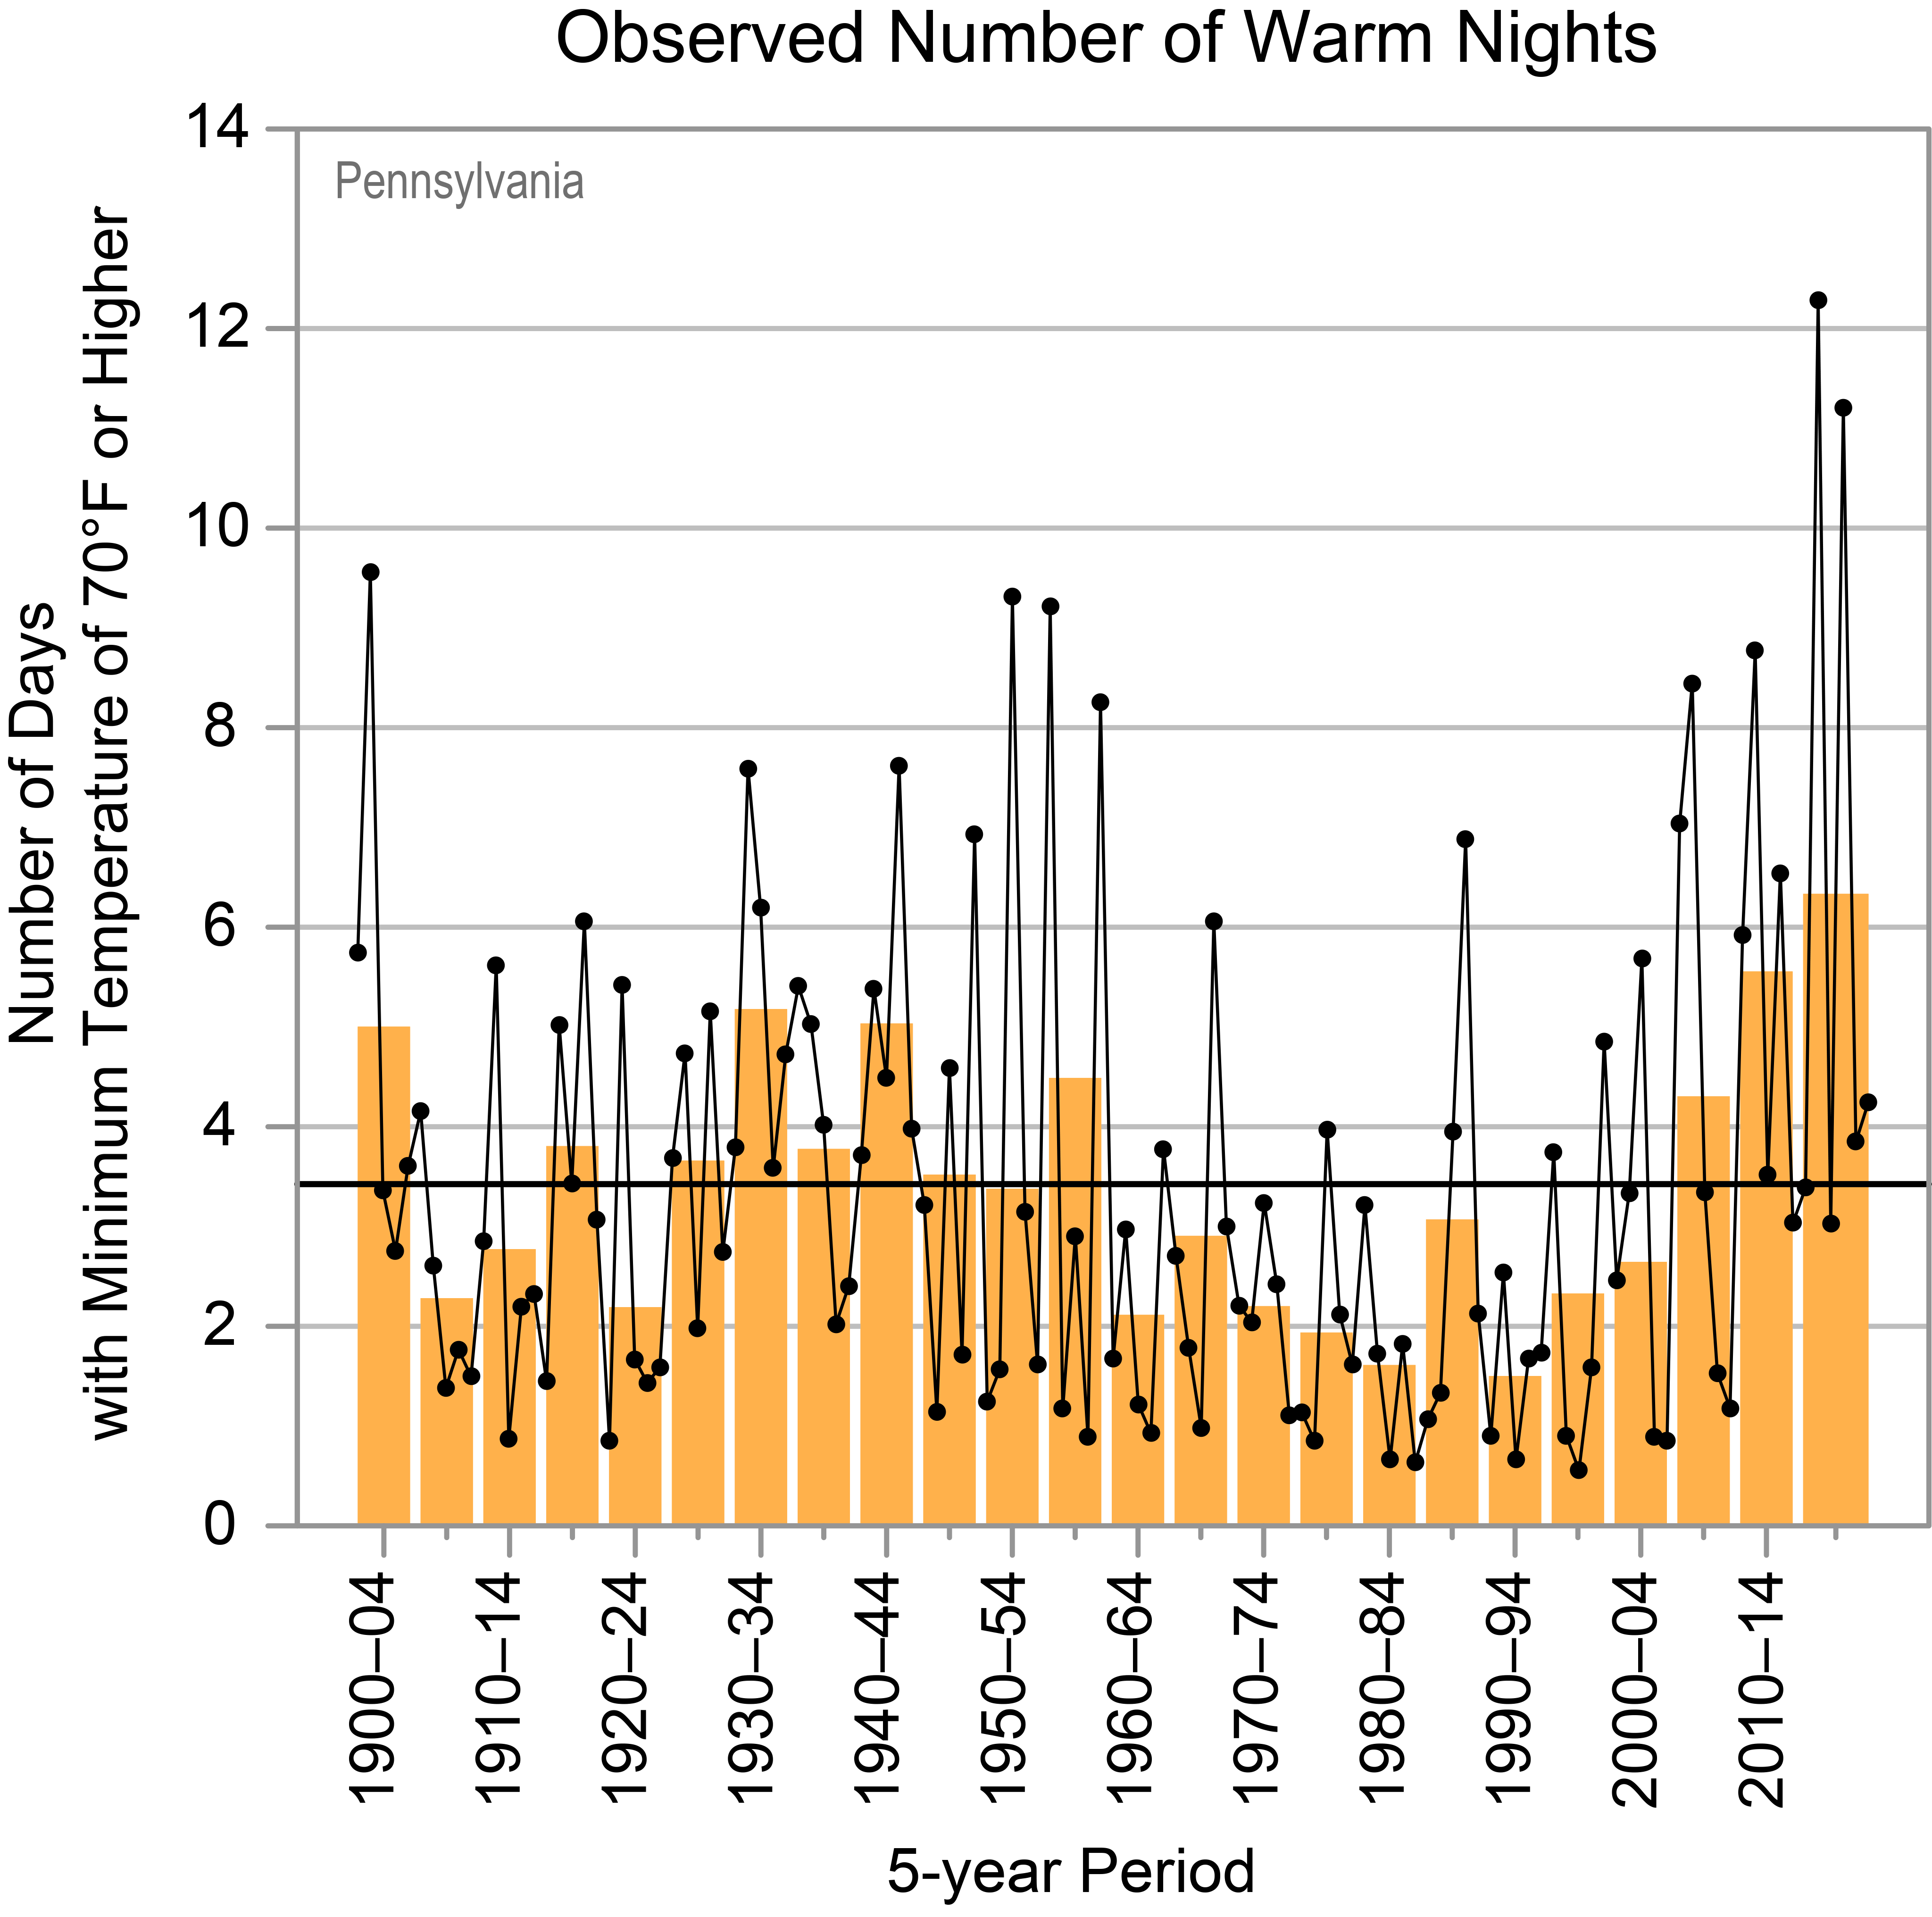
Since the beginning of the 20th century, temperatures in Pennsylvania have risen almost 2°F, and temperatures in the 2000s have been higher than in any other historical period (Figure 1). This warming has occurred mostly in the winter and spring, while summer and fall have not warmed as much. The small amount of summer warming is evident in the near average occurrence of hot days during the last 11 years (2010–2020; Figure 2a). However, there has been an increase in the number of warm nights and a decrease in the number of very cold nights (Figures 3 and 2b, respectively). Since record keeping began in 1895, the highest annual average temperature for the state was 51.8°F, set in 1998 and tied again in 2012.
Figure 2
a)
b)
c)
d)
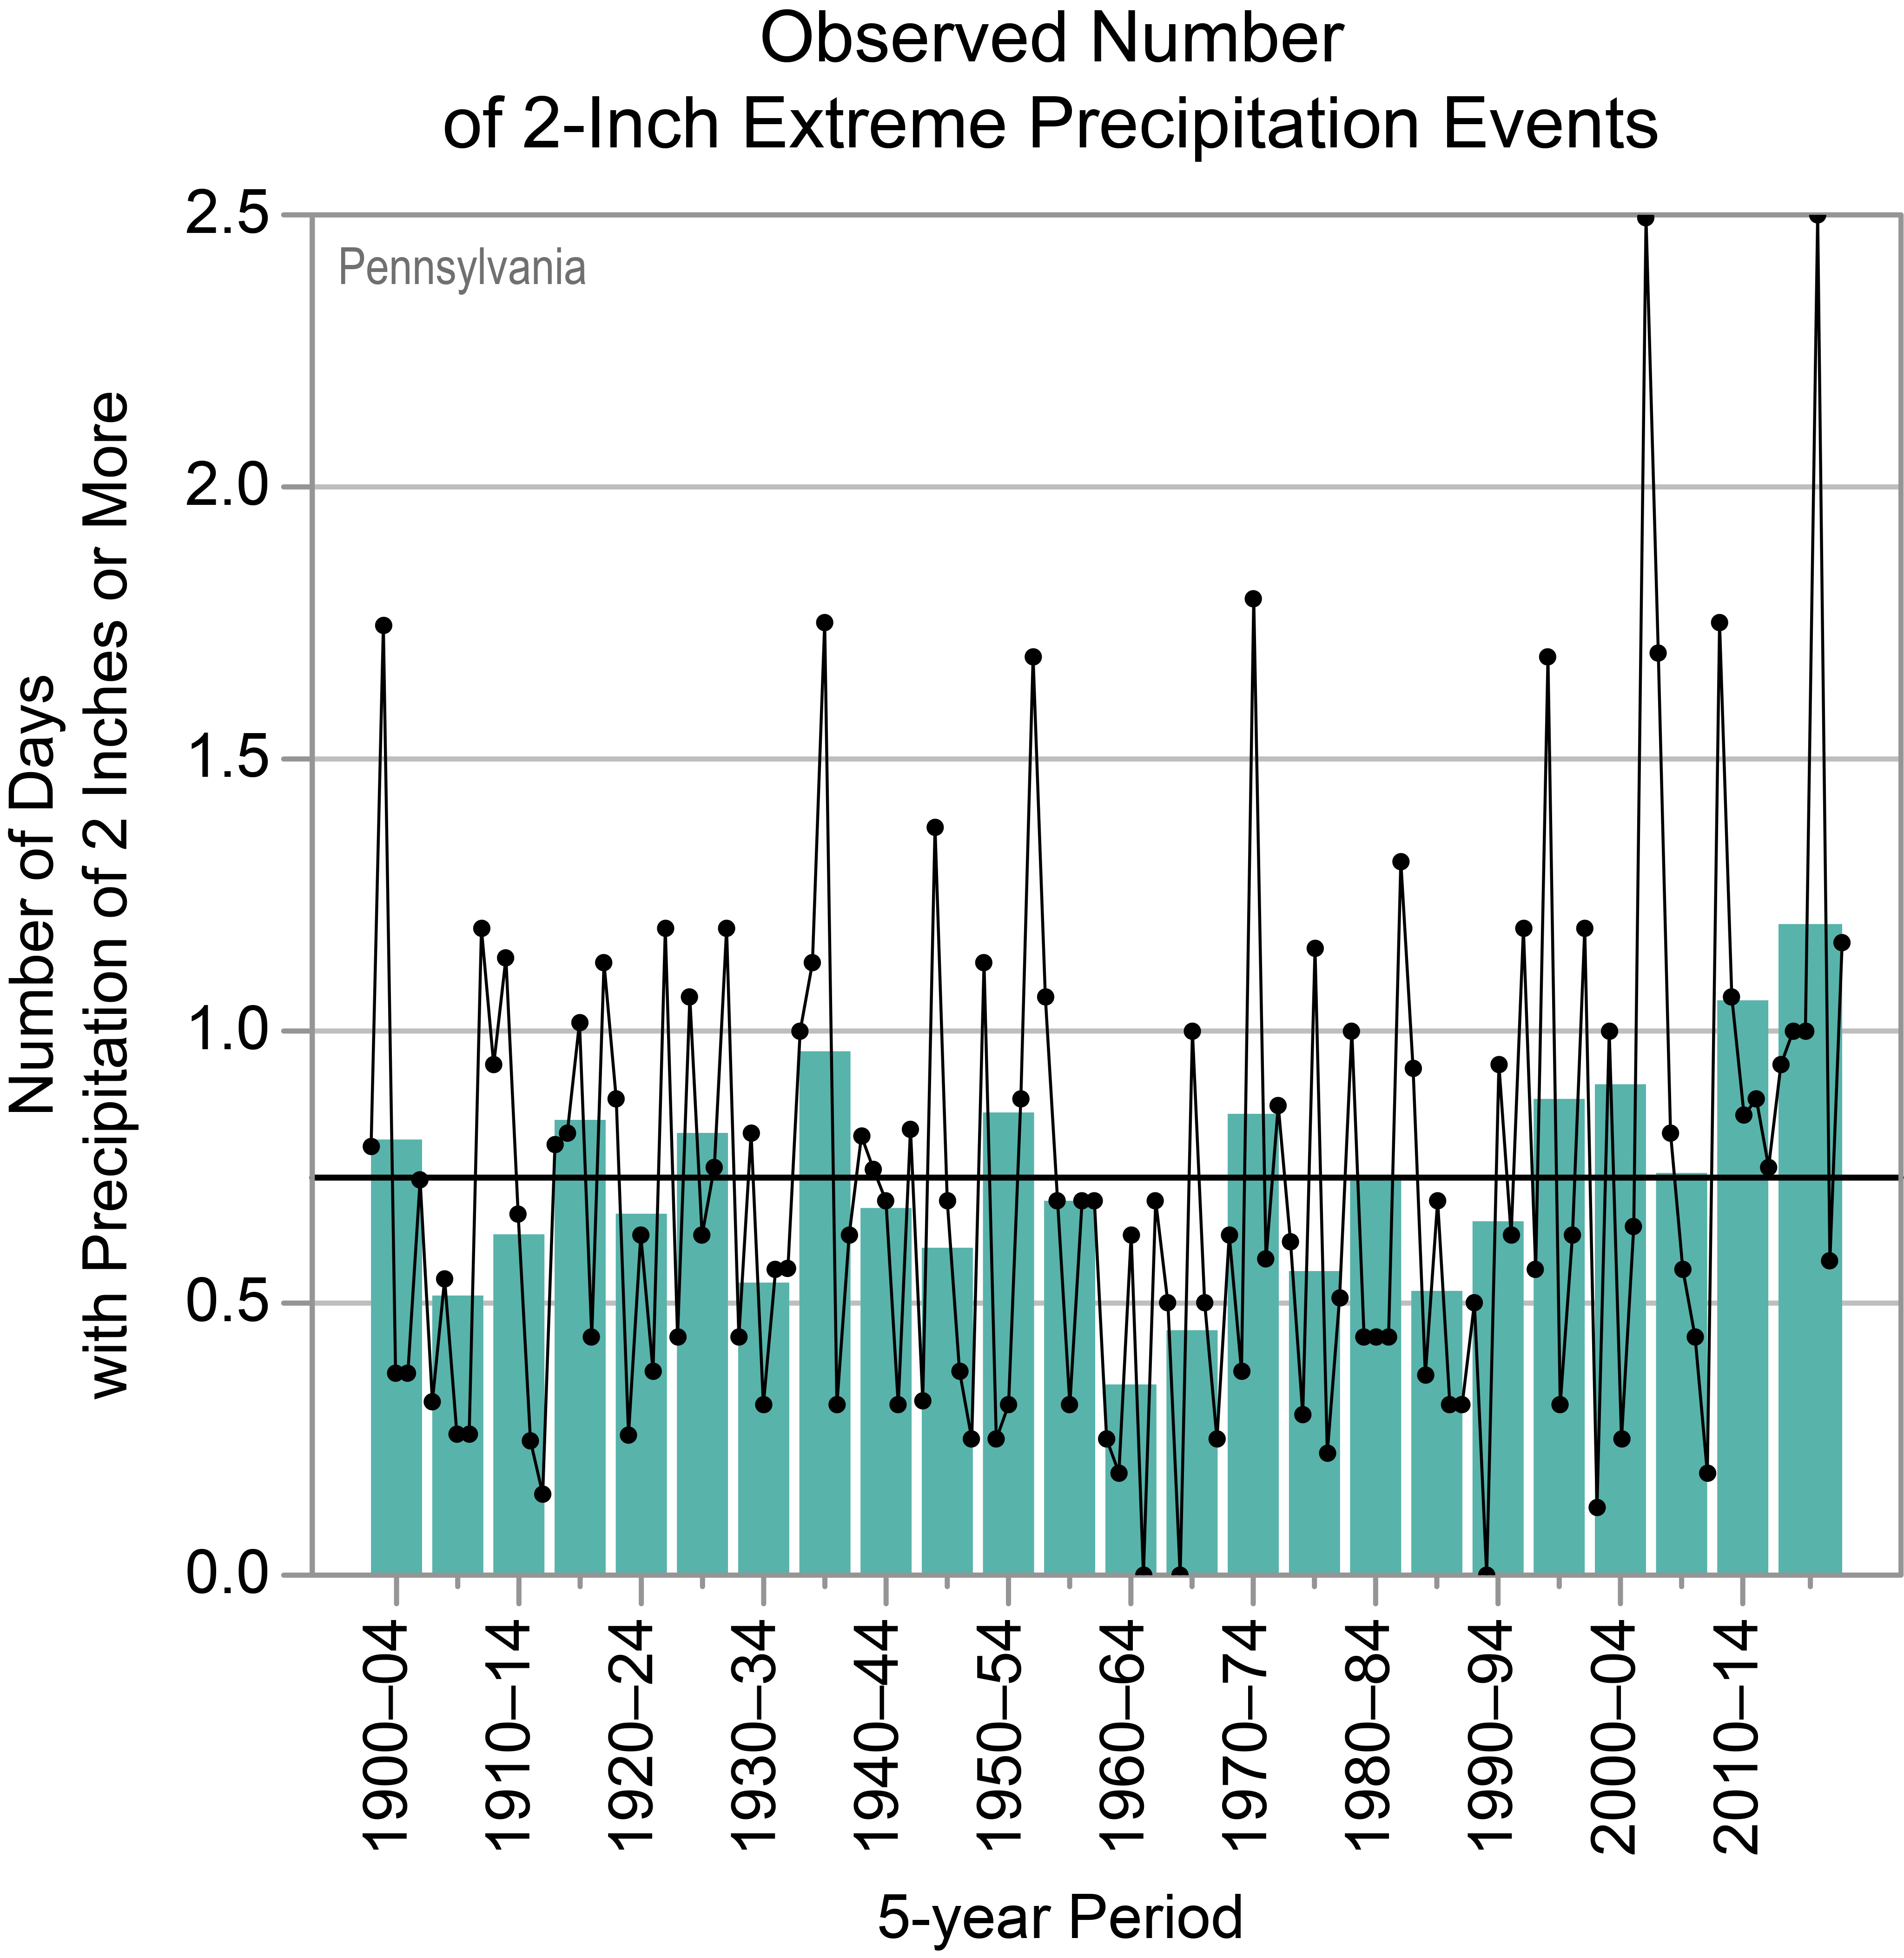
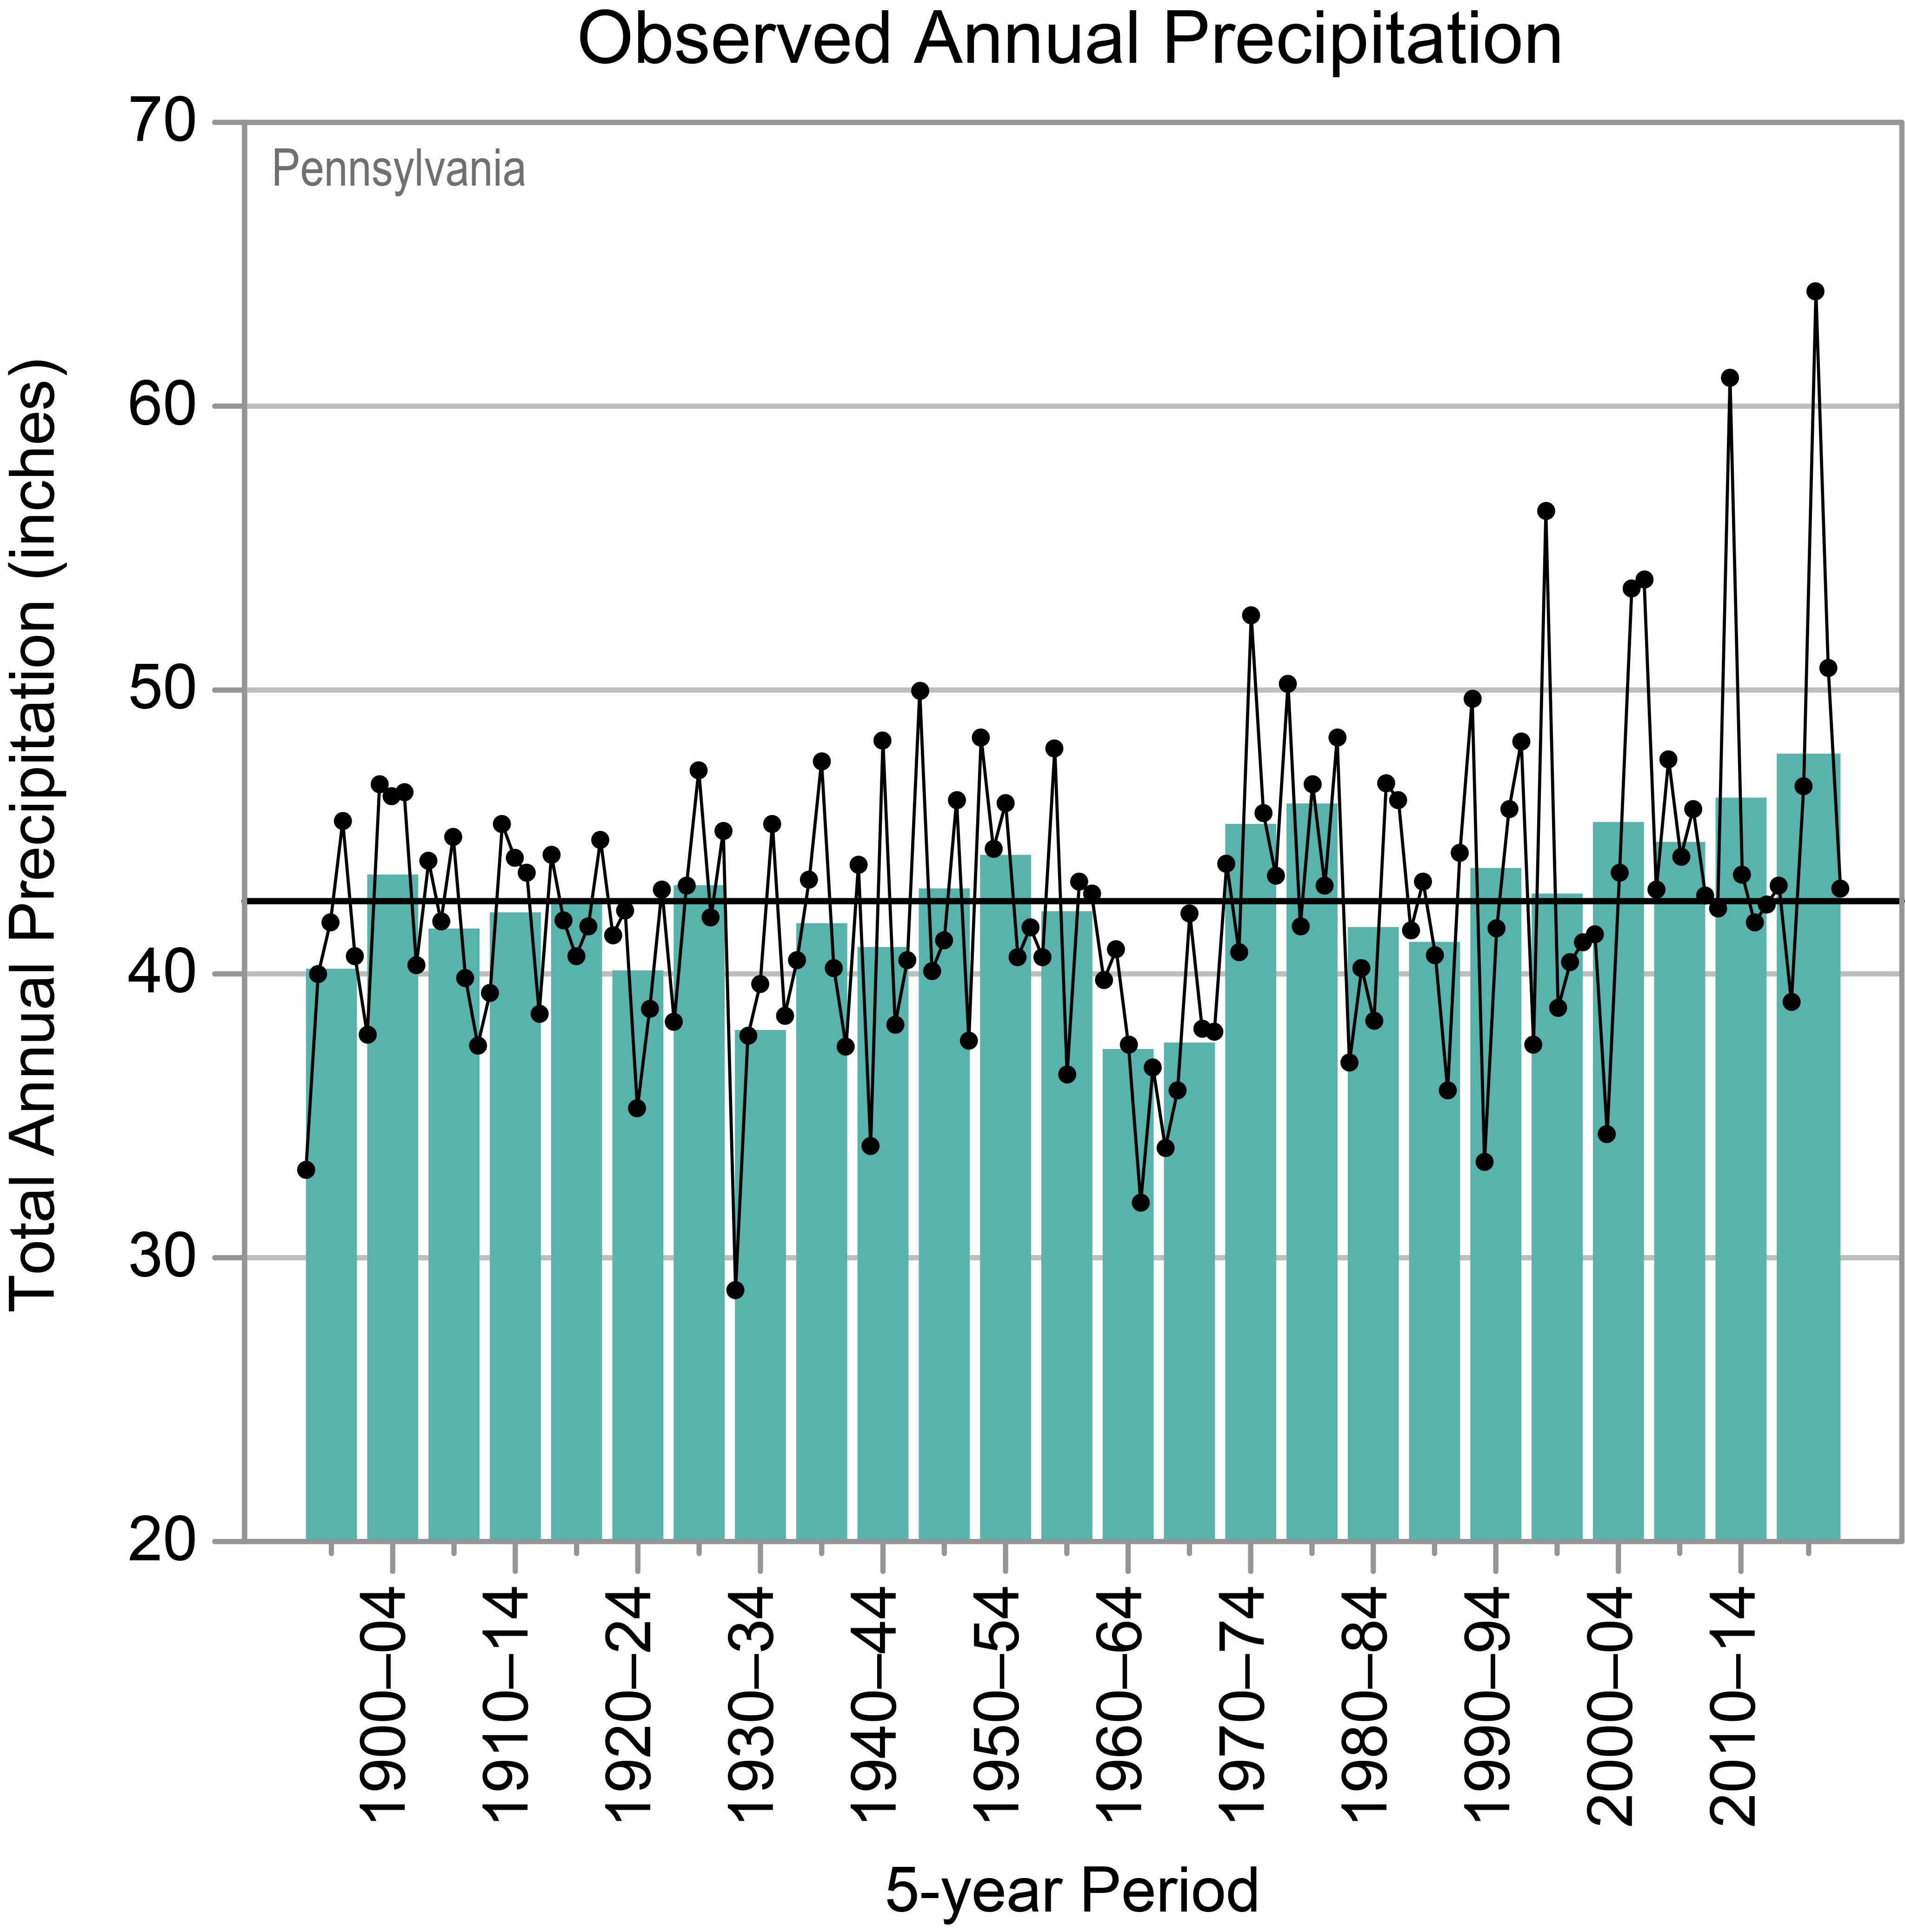
Pennsylvania experiences abundant precipitation. Statewide annual precipitation has ranged from a low of 28.9 inches in 1930 to a high of 64.0 inches in 2018. The driest multiyear periods were in the 1960s and the wettest in the 1970s and 2010s (Figure 2c). The driest consecutive 5-year interval was 1962–1966, and the wettest was 2016–2020. The above average precipitation the state has recently experienced is primarily due to increases in summer and fall precipitation. Winter storms are a common occurrence. Lake effect snows, caused by the warming and moistening of arctic air masses passing over the Great Lakes, are a hazard for the northwestern part of the state, which can receive more than 100 inches of snow annually. The Great Lakes can also experience flooding and erosion due to high water levels. Wet spring conditions contributed to record high water levels and flooding in 2017 and 2019. Cleanup costs, infrastructure damages, and agricultural losses were in the millions of dollars. The area to the east of the Appalachian Mountains is at risk for nor’easters, which are fueled by the large temperature contrast between the cold interior of the eastern United States and the warm moist air over the western Atlantic. The Blizzard of 1996, a classic nor’easter, dropped more than 30 inches of snow in several parts of the state; Philadelphia received 30.7 inches, and 27.6 inches of that fell in 24 hours, a record for the city. February 2010 brought three winter storms to the state, causing Philadelphia, Pittsburgh, and Harrisburg to have their snowiest month on record. The blizzard of 2016 brought high winds and heavy snow; Allentown recorded more than 30 inches.
The number of extreme precipitation events has increased (Figure 2d). These rains can cause devastating flooding, particularly in the state’s smaller streams and tributaries. One of the worst natural disasters in the history of the United States was the Great Flood of 1889, which was caused by intense, heavy rains and a catastrophic failure of the South Fork Dam upstream of Johnstown. The flood and subsequent fires killed more than 2,000 people and caused millions of dollars in damages. Heavy rains can cause particularly damaging floods when they combine with spring snowmelt. In 1936, runoff from rain falling on snow caused a record flood on the Monongahela River. The state can also experience short-term droughts, such as in 2002, 2016–2017, and 2020, which have an effect on agriculture.
Tropical cyclones occasionally pass through the state and are yet another cause of heavy rainfall and widespread flooding. Over a 2-week period in 2011, the remnants of both Hurricane Irene and Tropical Storm Lee drenched Pennsylvania in heavy rains and caused historic flooding. Several rivers and creeks reached record-high levels, including the Swatara Creek, which crested at 27.2 feet near Hershey (flood stage is 7 feet), and the Susquehanna River, which hit 42.6 feet in Wilkes-Barre (flood stage is 22 feet). Damages across the state were estimated to exceed $100 million. One of the worst storms to hit the state was Tropical Storm Agnes in 1972. Agnes caused torrential rainfall, dropping more than 10 inches in parts of the state and causing catastrophic flooding, with statewide damages estimated at almost $3 billion.
Thunderstorms are a common occurrence during the warmer months, and the most severe of these can occasionally cause extensive damages and loss of life. On June 30, 2012, a severe derecho (an organized thunderstorm complex with high winds) passed through the state, causing extensive wind damage and power outages. Although Pennsylvania experiences only a few tornadoes each year, these events have the potential to cause widespread destruction. On May 31, 1985, a storm caused 21 tornadoes across the northern and western counties, killing more than 60 people and destroying more than 1,000 homes. One of these tornadoes destroyed much of the town of Wheatland and is the only F5 tornado in the state’s history.
Large temperature increases are possible for the future if greenhouse gas concentrations continue to increase (Figure 1). Even under a lower emissions pathway, annual average temperatures are projected to most likely exceed historical record levels by the middle of this century. However, a large range of temperature increases is projected under both pathways, and under the lower pathway, a few projections are only slightly warmer than historical records. Extreme heat is a particular concern for Philadelphia and other urban areas, where the urban heat island effect raises summer temperatures. High temperatures combined with high humidity can create dangerous heat index values. Pennsylvania has experienced several heat waves in recent years. One of the worst peaked on July 22, 2011, when most of the state experienced high temperatures above 95°F and many locations experienced temperatures above 100°F. On that date, Reading reported an all-time high of 106°F, while Scranton reported its highest minimum temperature of 80°F. July 2020 was the all-time hottest month for Scranton and Harrisburg; Philadelphia and Scranton recorded their greatest number of 90°F days for any month (21 and 16, respectively). July 2020 also tied for the all-time hottest month for the state. While heat waves are projected to become more intense, cold waves are projected to become less intense.
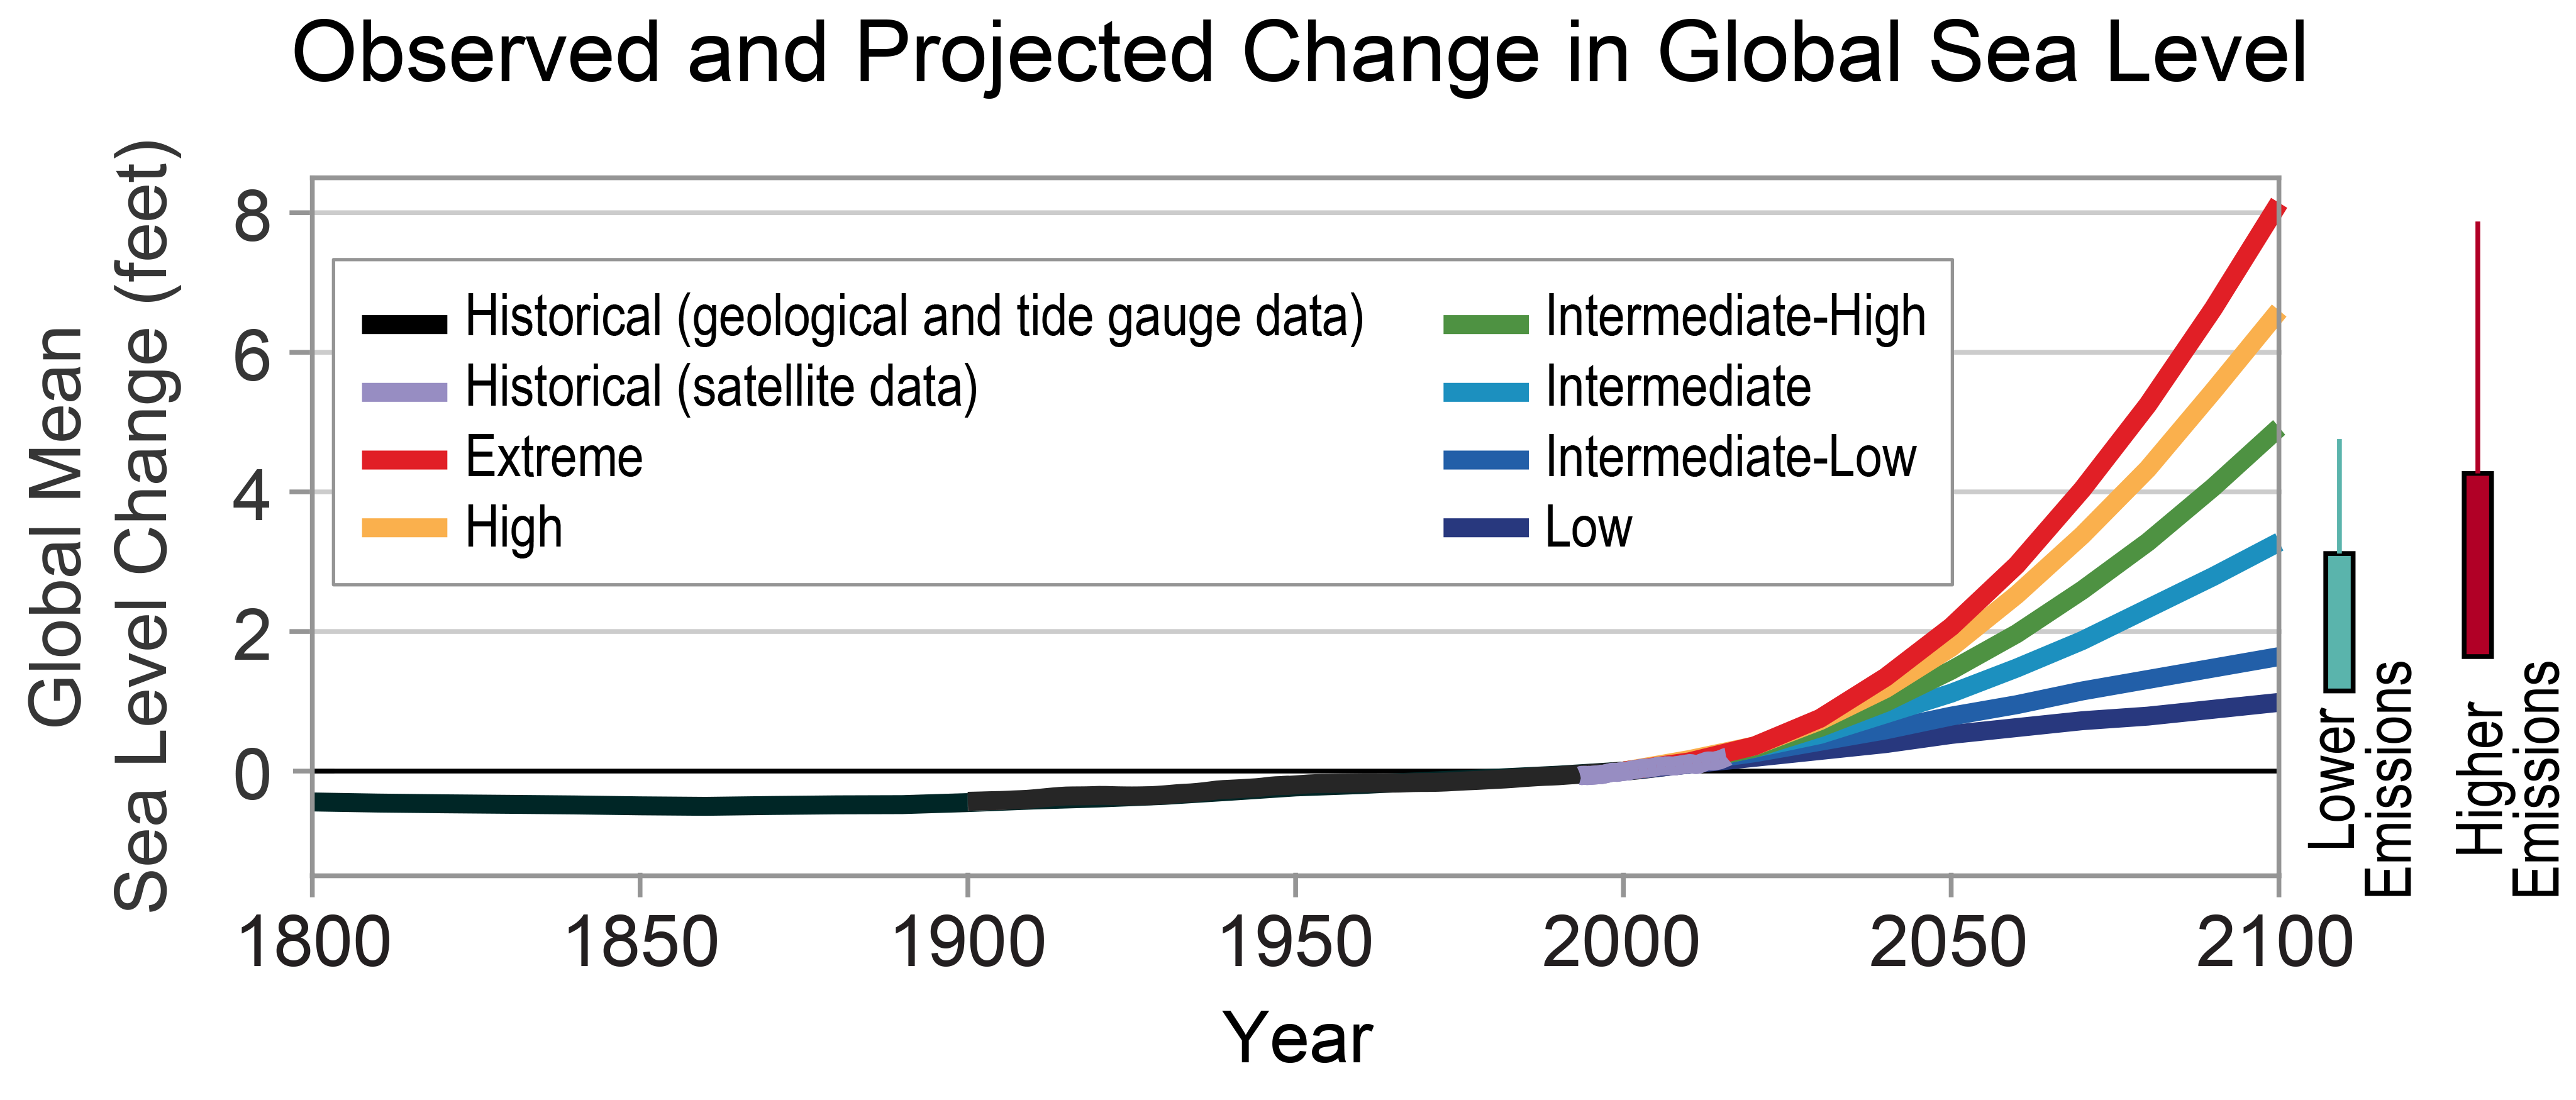
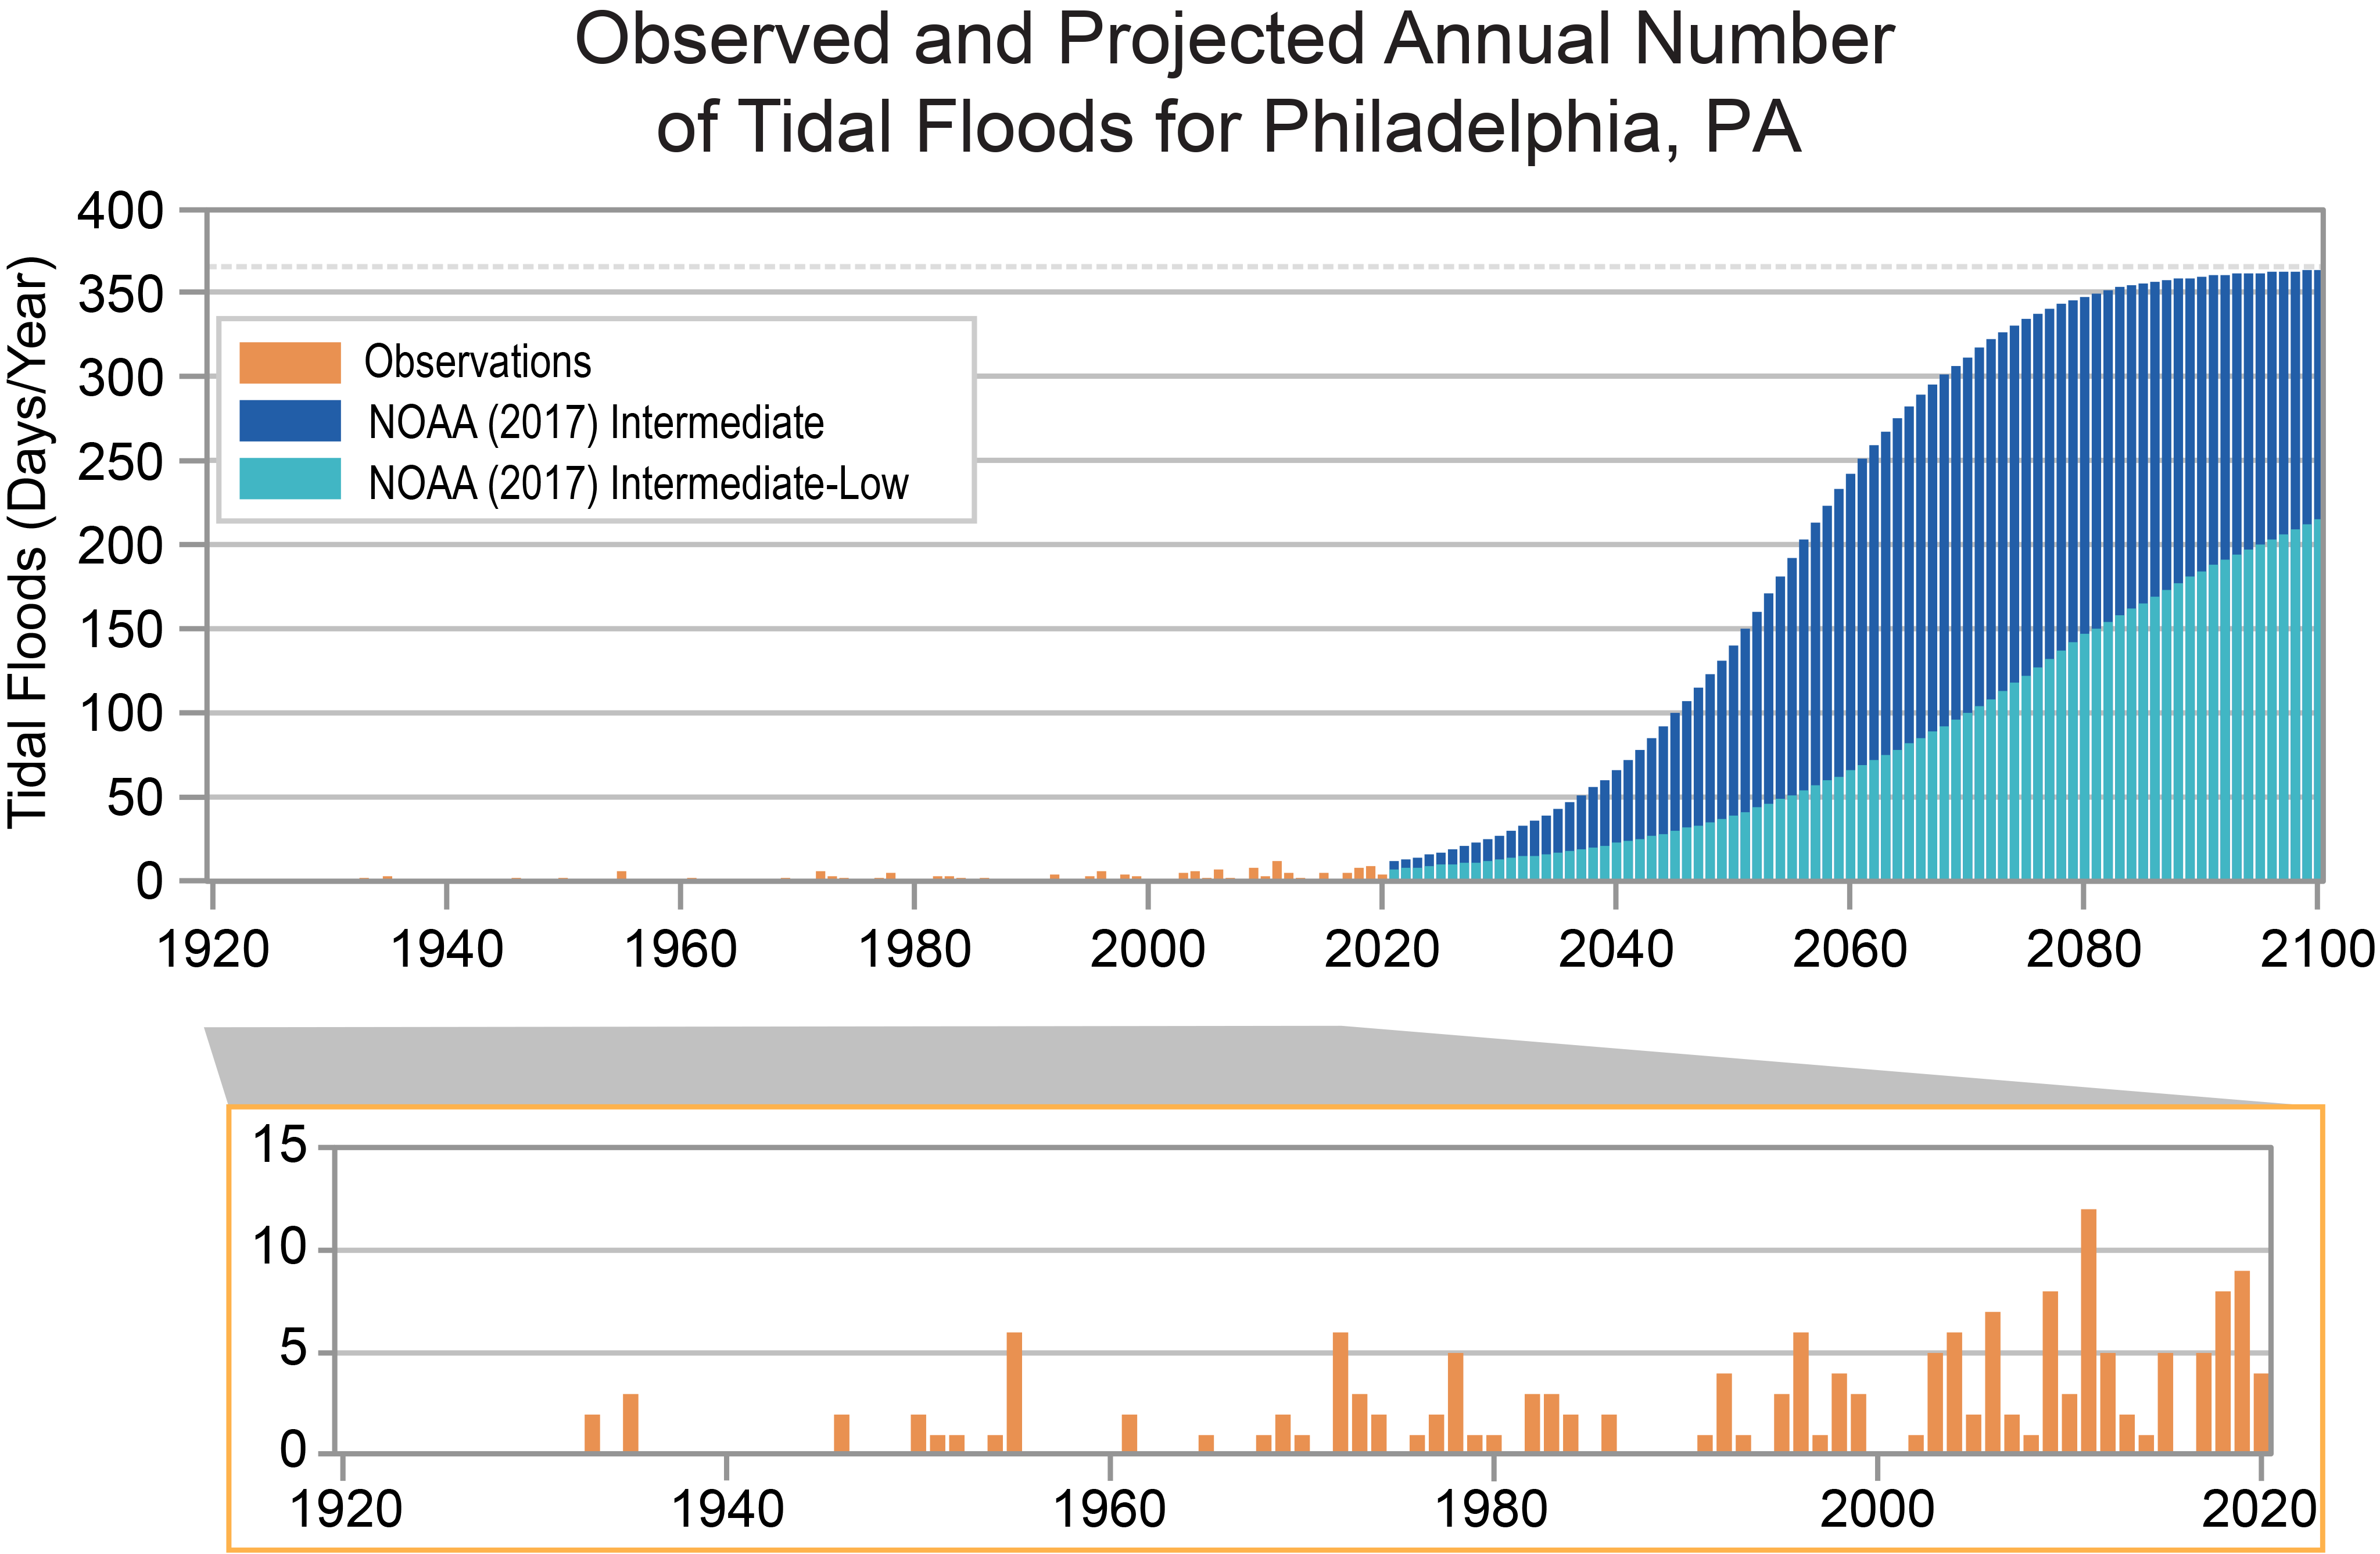
Pennsylvania’s coastline runs along the Delaware Estuary, and increasing temperatures raise concerns for sea level rise in these coastal areas. Since 1900, global average sea level has risen by about 7–8 inches. It is projected to rise another 1–8 feet, with a likely range of 1–4 feet, by 2100 as a result of both past and future emissions from human activities (Figure 4). Even if storm patterns remain the same, sea level rise will increase the frequency, extent, and severity of coastal flooding. This is a particularly serious risk for Philadelphia, where the observed sea level rise over the past century has exceeded the global average. Sea level rise has caused an increase in tidal floods associated with nuisance-level impacts. Nuisance floods are events in which water levels exceed the local threshold (set by NOAA’s National Weather Service) for minor impacts. These events can damage infrastructure, cause road closures, and overwhelm storm drains. As sea level has risen along the Pennsylvania coastline, the number of tidal flooding days (all days exceeding the nuisance level threshold) has also increased, with the greatest number occurring in 2011 (Figure 5).
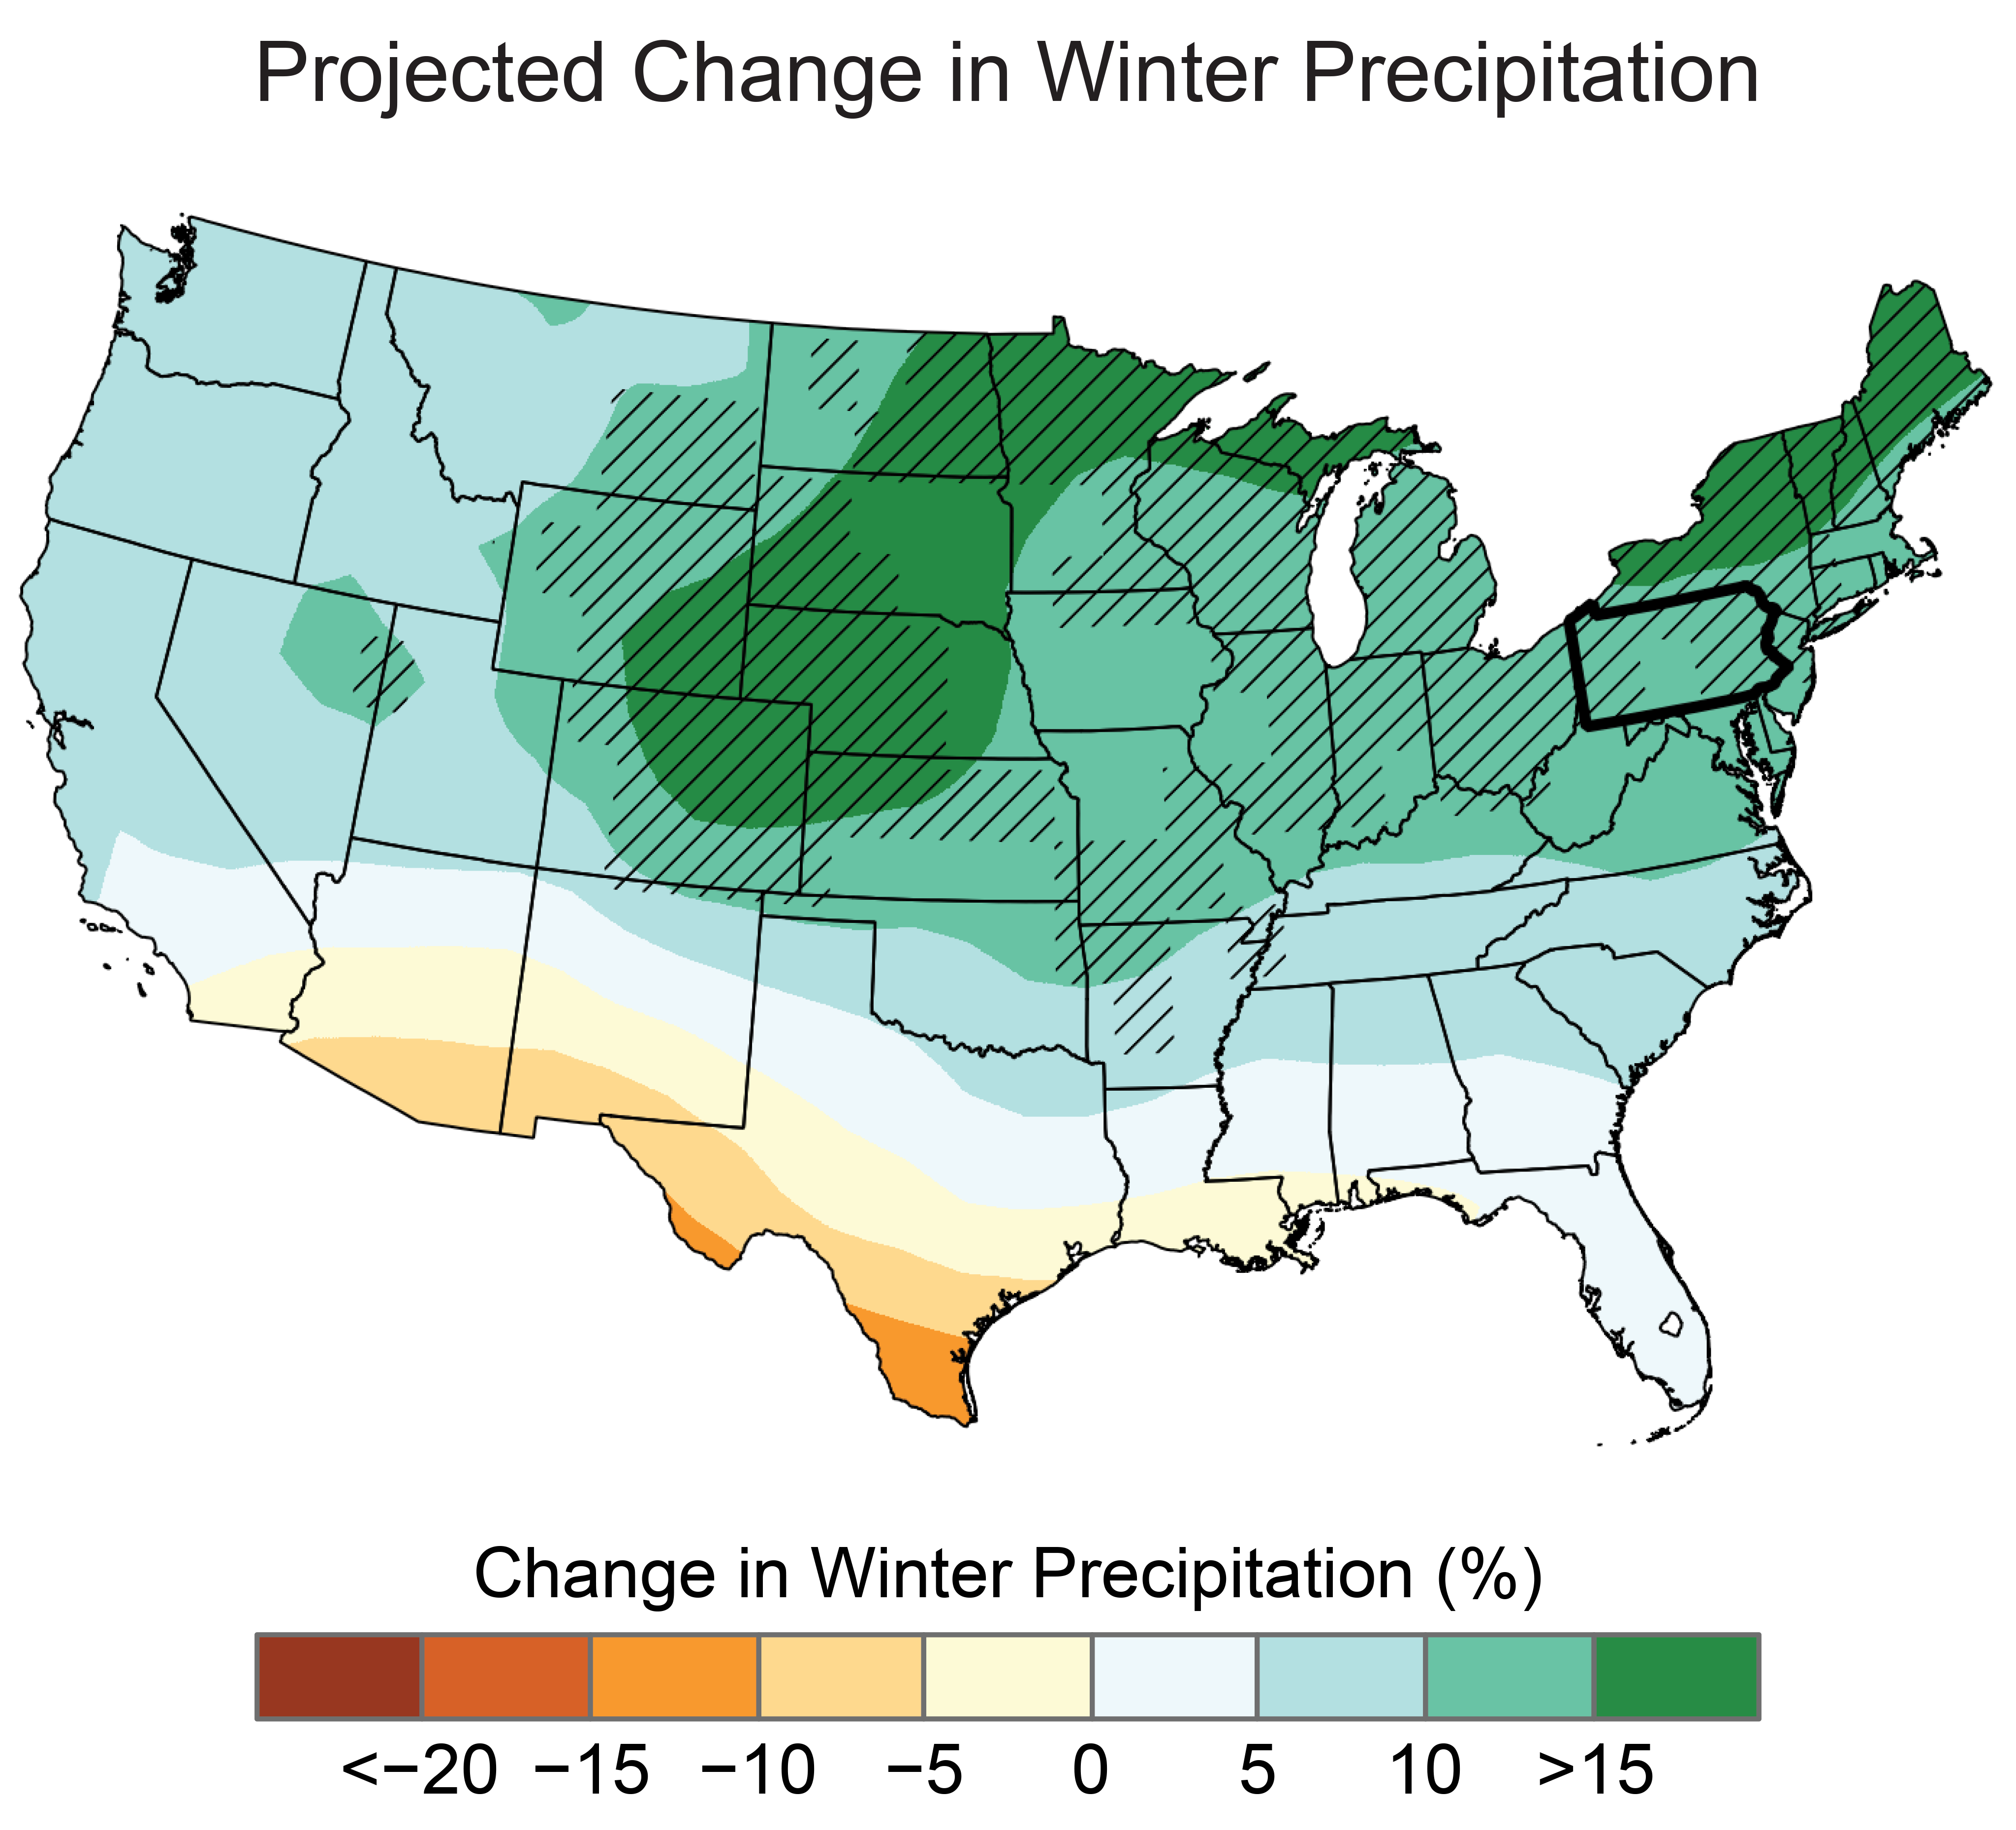
Winter and spring precipitation is projected to increase for Pennsylvania (Figure 6). In addition, extreme precipitation is projected to increase, expanding the risk for more frequent and intense floods. Heavier precipitation and higher temperatures causing earlier snowmelt increase the risk of springtime flooding, which could pose a threat to Pennsylvania’s agricultural industry by delaying planting and reducing yields.
Details on observations and projections are available on the Technical Details and Additional Information page.
RESOURCES
- Brown, D.P., 2011: Tropical Cyclone Report: Tropical Storm Lee, 2–5 September 2011. AL132011. National Oceanic and Atmospheric Administration, National Hurricane Center, Miami, FL, 35 pp. https://www.nhc.noaa.gov/data/tcr/AL132011_Lee.pdf
- Hayhoe, K., D.J. Wuebbles, D.R. Easterling, D.W. Fahey, S. Doherty, J. Kossin, W. Sweet, R. Vose, and M. Wehner, 2018: Our changing climate. In: Impacts, Risks, and Adaptation in the United States: Fourth National Climate Assessment, Volume II. Reidmiller, D.R., C.W. Avery, D.R. Easterling, K.E. Kunkel, K.L.M. Lewis, T.K. Maycock, and B.C. Stewart, Eds. U.S. Global Change Research Program, Washington, DC, 72–144. https://nca2018.globalchange.gov/chapter/2/
- Kunkel, K.E., L.E. Stevens, S.E. Stevens, L. Sun, E. Janssen, D. Wuebbles, J. Rennells, A. DeGaetano, and J.G. Dobson, 2013: Regional Climate Trends and Scenarios for the U.S. National Climate Assessment Part 1. Climate of the Northeast U.S. NOAA Technical Report NESDIS 142-1. National Oceanic and Atmospheric Administration, National Environmental Satellite, Data, and Information Service, Silver Spring, MD, 87 pp. https://nesdis-prod.s3.amazonaws.com/migrated/NOAA_NESDIS_Tech_Report_142-1-Climate_of_the_Northeast_US.pdf
- Lott, N., T. Ross, and M. Sittel, 1996: The Winter of '95–'96: A Season of Extremes. Technical Report 96-02. National Oceanic and Atmospheric Administration, National Climatic Data Center, Asheville, NC, 32 pp. https://www1.ncdc.noaa.gov/pub/data/techrpts/tr9602/tr9602.pdf
- Melillo, J.M., T.C. Richmond, and G.W. Yohe, 2014: Climate Change Impacts in the United States: The Third National Climate Assessment. Washington, DC, 841 pp. http://dx.doi.org/10.7930/J0Z31WJ2
- MRCC, n.d.: cli-MATE: MRCC Application Tools Environment. Midwestern Regional Climate Center, Urbana-Champaign, IL. https://mrcc.illinois.edu/CLIMATE/
- NOAA NCEI, 2011: State of the Climate: National Climate Report for September 2011. National Oceanic and Atmospheric Administration, National Centers for Environmental Information, Asheville, NC. http://www.ncdc.noaa.gov/sotc/national/201109
- NOAA NCEI, n.d.: Climate at a Glance: Statewide Time Series, Pennsylvania. National Oceanic and Atmospheric Administration, National Centers for Environmental Information, Asheville, NC, accessed March 12, 2021. https://www.ncdc.noaa.gov/cag/statewide/time-series/36/
- NOAA NIDIS, 2017: Quarterly Climate Impacts and Outlook for the Great Lakes Region—June 2017. National Oceanic and Atmospheric Administration, National Integrated Drought Information System, Boulder, CO, 2 pp. http://www.nrcc.cornell.edu/services/reports/reports/GL2017-06.pdf
- NOAA NIDIS, 2017: Quarterly Climate Impacts and Outlook for the Great Lakes Region—September 2017. National Oceanic and Atmospheric Administration, National Integrated Drought Information System, Boulder, CO, 2 pp. https://www.drought.gov/sites/default/files/2020-07/Great%20Lakes%20Summer%202017.pdf
- NOAA NIDIS, 2019: Quarterly Climate Impacts and Outlook for the Great Lakes Region—June 2019. National Oceanic and Atmospheric Administration, National Integrated Drought Information System, Boulder, CO, 2 pp. https://www.drought.gov/sites/default/files/2020-10/Great%20Lakes%20Spring%202019%20v2.pdf
- NOAA NIDIS, 2019: Quarterly Climate Impacts and Outlook for the Great Lakes Region—September 2019. National Oceanic and Atmospheric Administration, National Integrated Drought Information System, Boulder, CO, 2 pp. https://www.drought.gov/sites/default/files/2020-10/Great%20Lakes%20Summer%202019%20v2.pdf
- NOAA NWS, n.d.: A Decade of Devastating Storms 2004–2013. National Oceanic and Atmospheric Administration, National Weather Service, Cleveland Weather Forecast Office, Brooklyn Heights, OH. https://www.weather.gov/cle/event_2004-2013
- NOAA NWS, n.d.: Flooding in Pennsylvania. National Oceanic and Atmospheric Administration, National Weather Service, Silver Spring, MD. https://www.weather.gov/safety/flood-states-pa
- NOAA NWS, n.d.: Historic Long Island Flash Flooding—August 12–13, 2014. National Oceanic and Atmospheric Administration, National Weather Service, New York Weather Forecast Office, Upton, NY. https://www.weather.gov/okx/HistoricFlooding_081314
- NOAA NWS, n.d.: May 31, 1985 Tornado Outbreak: 35th Anniversary. National Oceanic and Atmospheric Administration, National Weather Service, State College Weather Forecast Office, State College, PA. https://www.weather.gov/ctp/TornadoOutbreak_May311985
- NOAA NWS, n.d.: Severe Weather Climatology. National Oceanic and Atmospheric Administration, National Weather Service, State College Weather Forecast Office, State College, PA. https://www.weather.gov/ctp/SevereWeatherClimatology
- NOAA NWS, n.d.: Susquehanna River at Wilkes Barre. National Oceanic and Atmospheric Administration, National Weather Service, Binghamton Weather Forecast Office, Johnson City, NY. https://water.weather.gov/ahps2/hydrograph.php?wfo=bgm&gage=wbrp1
- NOAA NWS, n.d.: Swatara Creek Near Hershey. National Oceanic and Atmospheric Administration, National Weather Service, State College Weather Forecast Office, State College, PA. https://water.weather.gov/ahps2/hydrograph.php?wfo=ctp&gage=HERP1
- NOAA SPC, n.d.: June 29, 2012 Derecho, “The Ohio Valley/Mid-Atlantic Derecho of June 2012.” National Oceanic and Atmospheric Administration, Storm Prediction Center, Norman, OK. https://www.spc.noaa.gov/misc/AbtDerechos/casepages/jun292012page.htm
- NRCC, 2016: January Blizzard. Northeast Regional Climate Center, Cornell University, Ithaca, NY, 2 pp. http://www.nrcc.cornell.edu/services/special/reports/blizzard2016.pdf
- NRCC, 2020: A July for the Record Books. Publications & Services. Northeast Regional Climate Center, Cornell University, Ithaca, NY. http://www.nrcc.cornell.edu/services/blog/2020/08/01/index.html
- NRCC, n.d.: Northeast Overview—February 2010, Monthly Summary. Northeast Regional Climate Center, Cornell University, Ithaca, NY. http://www.nrcc.cornell.edu/regional/narrative/narrative.html
- NRCC, n.d.: Northeast Regional Climate Center SC ACIS (Applied Climate Information System) Version 2. Northeast Regional Climate Center, Cornell University, Ithaca, NY, last modified May 4, 2021. http://scacis.rcc-acis.org/
- Parris, A., P. Bromirski, V. Burkett, D. Cayan, M. Culver, J. Hall, R. Horton, K. Knuuti, R. Moss, J. Obeysekera, A. Sallenger, and J. Weiss, 2012: Global Sea Level Rise Scenarios for the United States National Climate Assessment. NOAA Technical Report OAR CPO-1. National Oceanic and Atmospheric Administration, Office of Oceanic and Atmospheric Research, Climate Program Office, Silver Spring, MD, 33 pp. https://repository.library.noaa.gov/view/noaa/11124
- Pennsylvania State Climatologist, 2011: July 2011—Pennsylvania Weather Recap. The Pennsylvania Observer, July 28, 2011. State College, PA. http://www.climate.psu.edu/features/summary/Summary0711.pdf
- Sweet, W., G. Dusek, J. Obeysekera, and J. Marra, 2018: Patterns and Projections of High Tide Flooding Along the U.S. Coastline Using a Common Impact Threshold. NOAA Technical Report NOS CO-OPS 086. National Oceanic and Atmospheric Administration, National Ocean Service, Center for Operational Oceanographic Products and Services, Silver Spring, MD, 56 pp. https://tidesandcurrents.noaa.gov/publications/techrpt86_PaP_of_HTFlooding.pdf
- Sweet, W., S. Simon, G. Dusek, D. Marcy, W. Brooks, M. Pendleton, and J. Marra, 2021: 2021 State of High Tide Flooding and Annual Outlook. NOAA High Tide Flooding Report. National Oceanic and Atmospheric Administration, National Ocean Service, Center for Operational Oceanographic Products and Services, Silver Spring, MD, 28 pp. https://tidesandcurrents.noaa.gov/publications/2021_State_of_High_Tide_Flooding_and_Annual_Outlook_Final.pdf
- Sweet, W.V., R.E. Kopp, C.P. Weaver, J. Obeysekera, R.M. Horton, E.R. Thieler, and C. Zervas, 2017: Global and Regional Sea Level Rise Scenarios for the United States. NOAA Technical Report NOS CO-OPS 083. National Oceanic and Atmospheric Administration, National Ocean Service, Center for Operational Oceanographic Products and Services, Silver Spring, MD, 75 pp. https://tidesandcurrents.noaa.gov/publications/techrpt83_Global_and_Regional_SLR_Scenarios_for_the_US_final.pdf
- Vose, R.S., D.R. Easterling, K.E. Kunkel, A.N. LeGrande, and M.F. Wehner, 2017: Temperature changes in the United States. In: Climate Science Special Report: Fourth National Climate Assessment, Volume I. Wuebbles, D.J., D.W. Fahey, K.A. Hibbard, D.J. Dokken, B.C. Stewart, and T.K. Maycock, Eds. U.S. Global Change Research Program, Washington, DC, 185–206. http://doi.org/10.7930/J0N29V45