AKALARAZCACOCTDEFLGAHIIAIDILINKSKYLAMAMDMEMIMNMOMSMTNCNDNENHNJNMNVNYOHOKORPARISCSDTNTXUTVAVTWAWIWVWYDCUSAPRWPI Skip to main content
  • About
  • States

      A–H

    • Alabama
    • Alaska
    • Arizona
    • Arkansas
    • California
    • Colorado
    • Connecticut
    • Delaware
    • Florida
    • Georgia
    • Hawai‘i

      I–M

    • Idaho
    • Illinois
    • Indiana
    • Iowa
    • Kansas
    • Kentucky
    • Louisiana
    • Maine
    • Maryland and the District of Columbia
    • Massachusetts
    • Michigan
    • Minnesota
    • Mississippi
    • Missouri
    • Montana

      N–P

    • Nebraska
    • Nevada
    • New Hampshire
    • New Jersey
    • New Mexico
    • New York
    • North Carolina
    • North Dakota
    • Ohio
    • Oklahoma
    • Oregon
    • Pennsylvania
    • Puerto Rico and the U.S. Virgin Islands

      Q–Z

    • Rhode Island
    • South Carolina
    • South Dakota
    • Tennessee
    • Texas
    • Utah
    • Vermont
    • Virginia
    • Washington
    • West Virginia
    • Wisconsin
    • Wyoming
    • Western Pacific Islands
  • Supplemental Materials
    • Abbreviations and Acronyms
    • Recommended Citations
    • Resources
    • Technical Details and Additional Information
  • Downloads
  • Credits

NOAA National Centers
for Environmental Information


State Climate Summaries 2022

TEXAS

Key Messages   Narrative   Downloads  

Austin, Texas Skyline
Photo by Norm Lanier
License: CC BY-NC

Key Message 1

Temperatures in Texas have risen almost 1.5˚F since the beginning of the 20th century. Historically unprecedented warming is projected during this century, with associated increases in extreme heat events.

Key Message 2

Although projected changes in annual precipitation are uncertain, increases in extreme precipitation events are projected. Higher temperatures will increase soil moisture loss during dry spells, increasing the intensity of naturally occurring droughts.

Key Message 3

Future changes in the number of landfalling hurricanes in Texas are difficult to project. As the climate warms, hurricane rainfall rates, storm surge height due to sea level rise, and the intensity of the strongest hurricanes are all projected to increase.

Texas Blue Bonnet
Photo by Steve Webel
License: CC BY-NC-ND

TEXAS

The Texas climate is characterized by hot summers and mild to cool winters. Three geographical features largely influence the state’s varied climate: the Rocky Mountains block intrusions of moist Pacific air from the west and tend to channel arctic air masses southward during the winter; the relatively flat central North American continent allows easy north and south movement of air masses; and the Gulf of Mexico serves as the primary source of moisture, which is most readily available to the eastern part of the state. As a result of these factors, the state exhibits large east-west variations in precipitation and is subject to frequent and varied extreme events, including hurricanes, tornadoes, droughts, heat waves, cold waves, and extreme precipitation. Due to rapid population growth, especially in urban areas, increased demand for limited water supplies may increase Texas’s vulnerability to naturally occurring droughts.


Figure 1

Observed and Projected Temperature Change
Time series of observed and projected temperature change (in degrees Fahrenheit) for Texas from 1900 to 2100 as described in the caption. Y-axis values range from minus 3.3 to positive 14.2 degrees. Observed annual temperature change from 1900 to 2020 shows variability and ranges from minus 2.0 to positive 3.1 degrees. By the end of the century, projected increases in temperature range from 2.5 to 7.6 degrees under the lower emissions pathway and from 6.9 to 13.4 degrees under the higher pathway.
Figure 1: Observed and projected changes (compared to the 1901–1960 average) in near-surface air temperature for Texas. Observed data are for 1900–2020. Projected changes for 2006–2100 are from global climate models for two possible futures: one in which greenhouse gas emissions continue to increase (higher emissions) and another in which greenhouse gas emissions increase at a slower rate (lower emissions). Temperatures in Texas (orange line) have risen almost 1.5°F since the beginning of the 20th century. Shading indicates the range of annual temperatures from the set of models. Observed temperatures are generally within the envelope of model simulations of the historical period (gray shading). Historically unprecedented warming is projected during this century. Less warming is expected under a lower emissions future (the coldest end-of-century projections being about 2°F warmer than the historical average; green shading) and more warming under a higher emissions future (the hottest years in the hottest end-of-century projections being about 10°F warmer than the hottest year in the historical record; red shading). Sources: CISESS and NOAA NCEI.

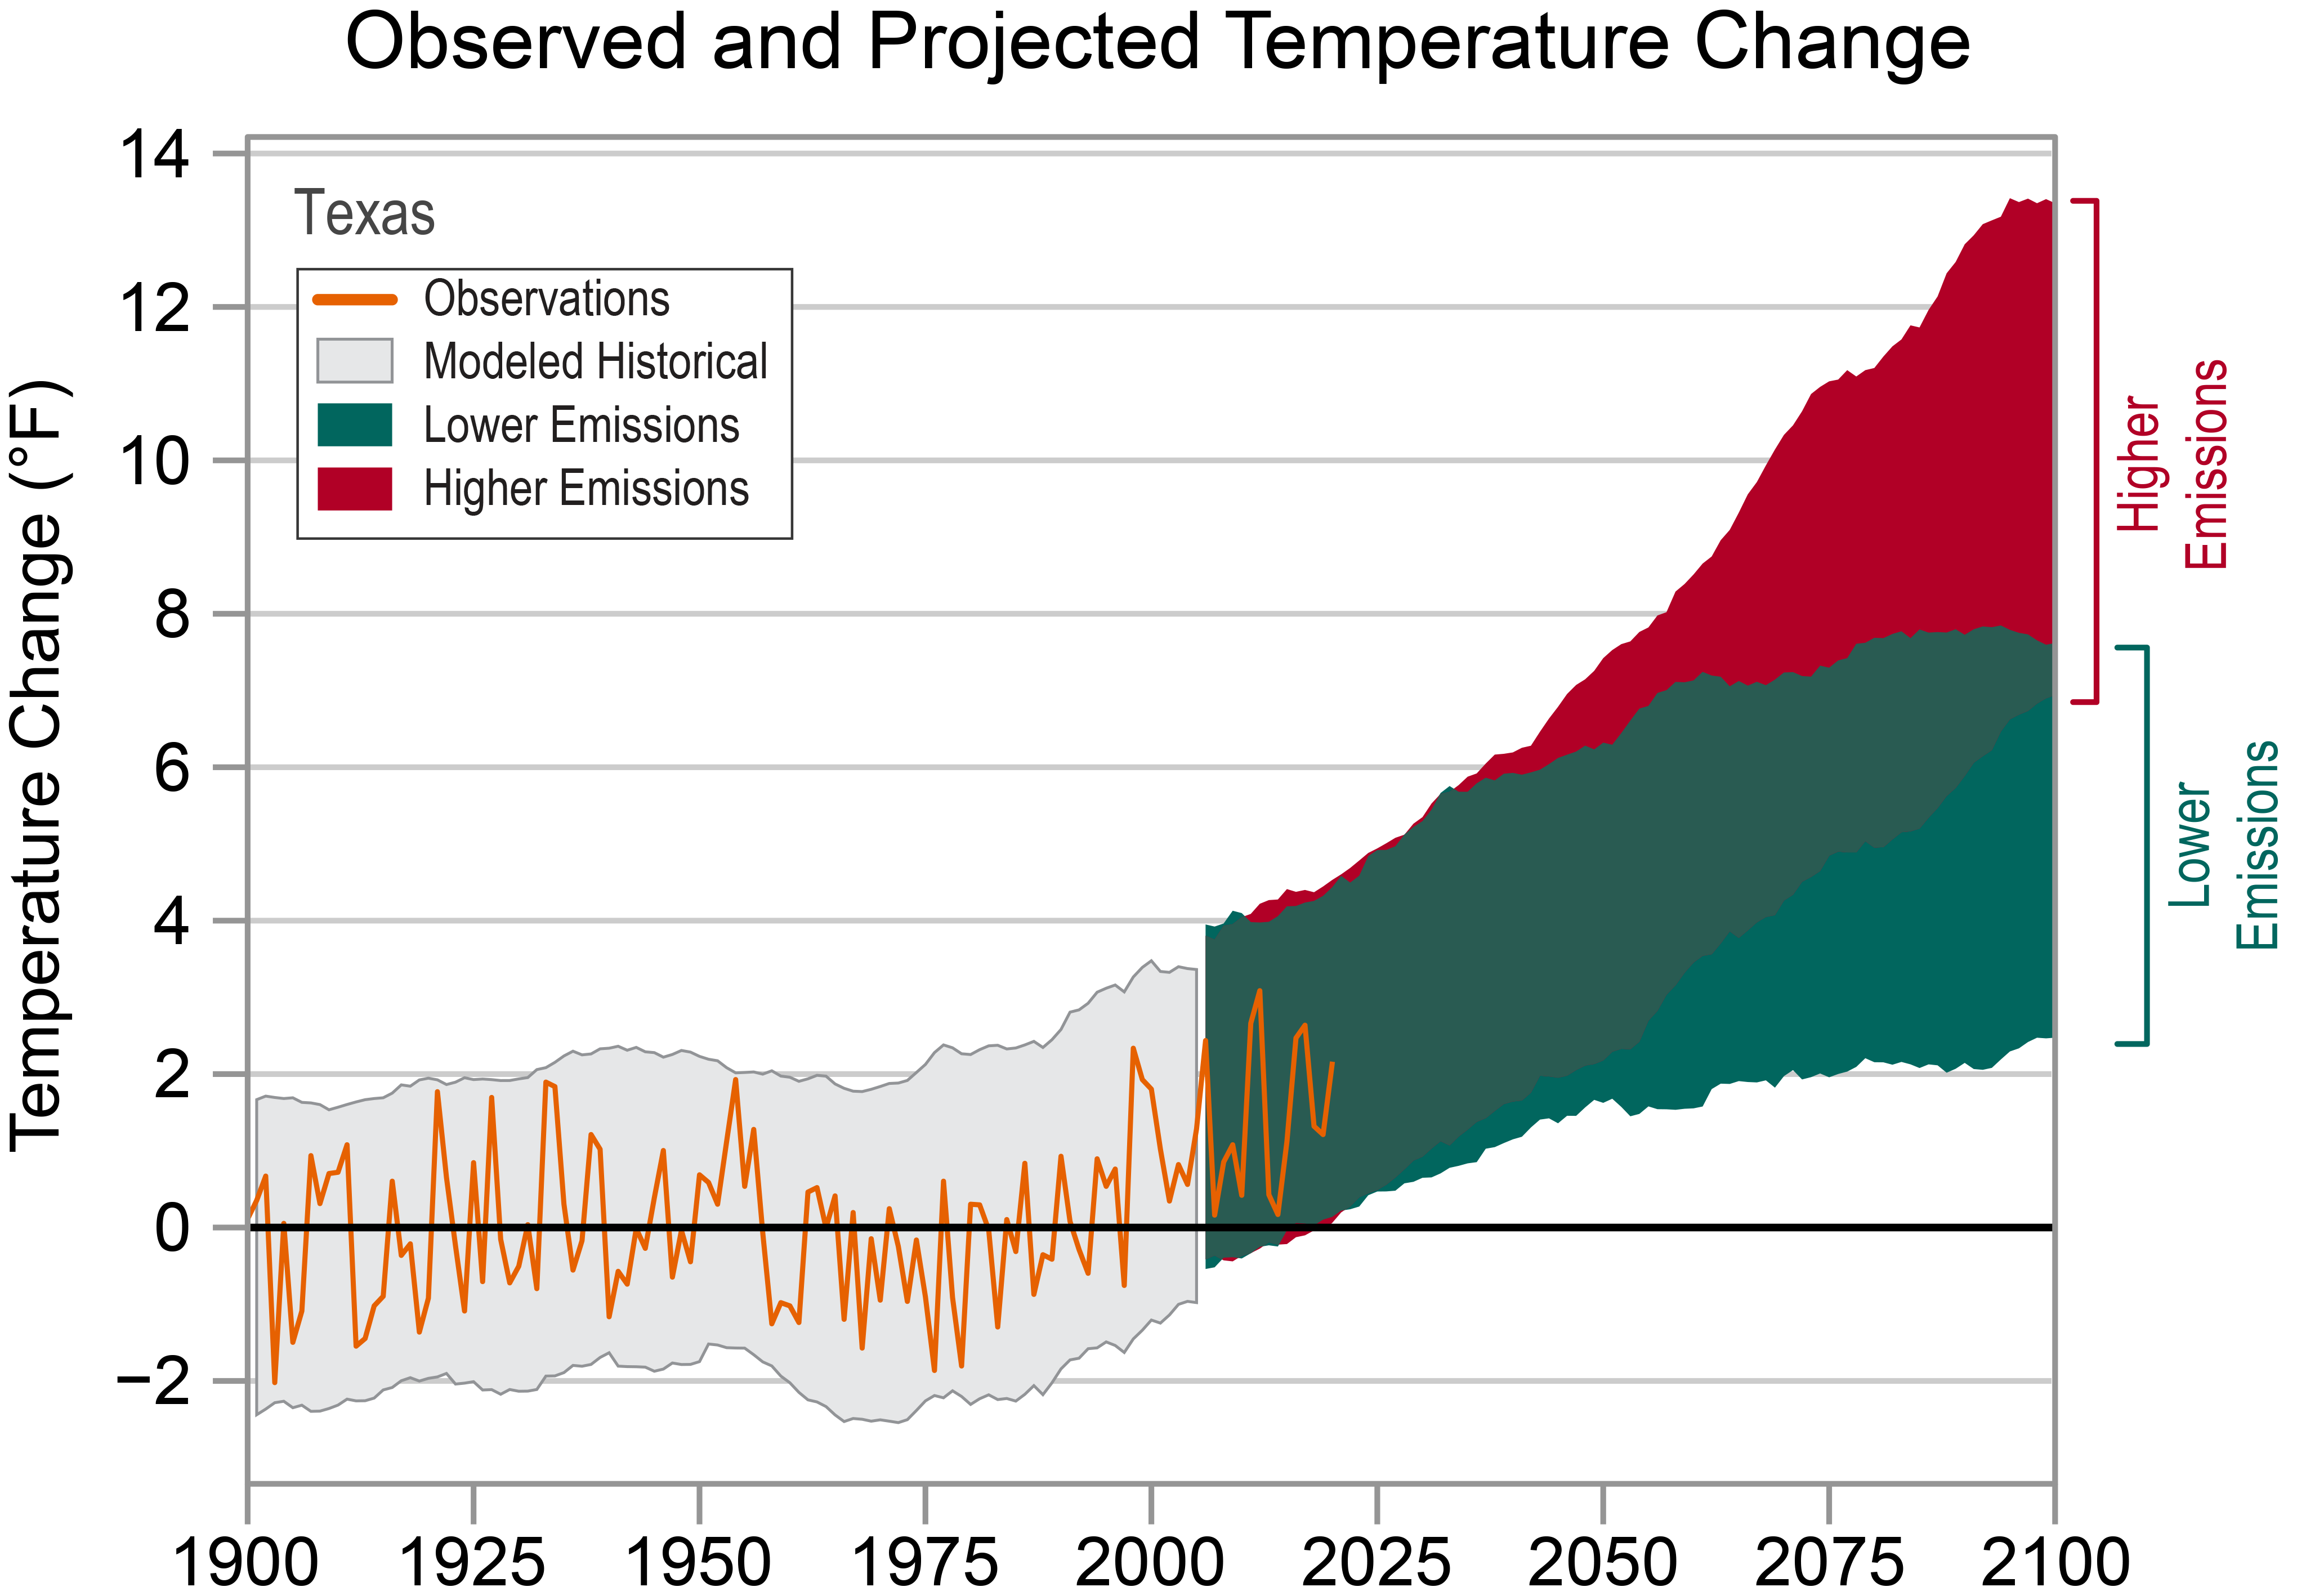
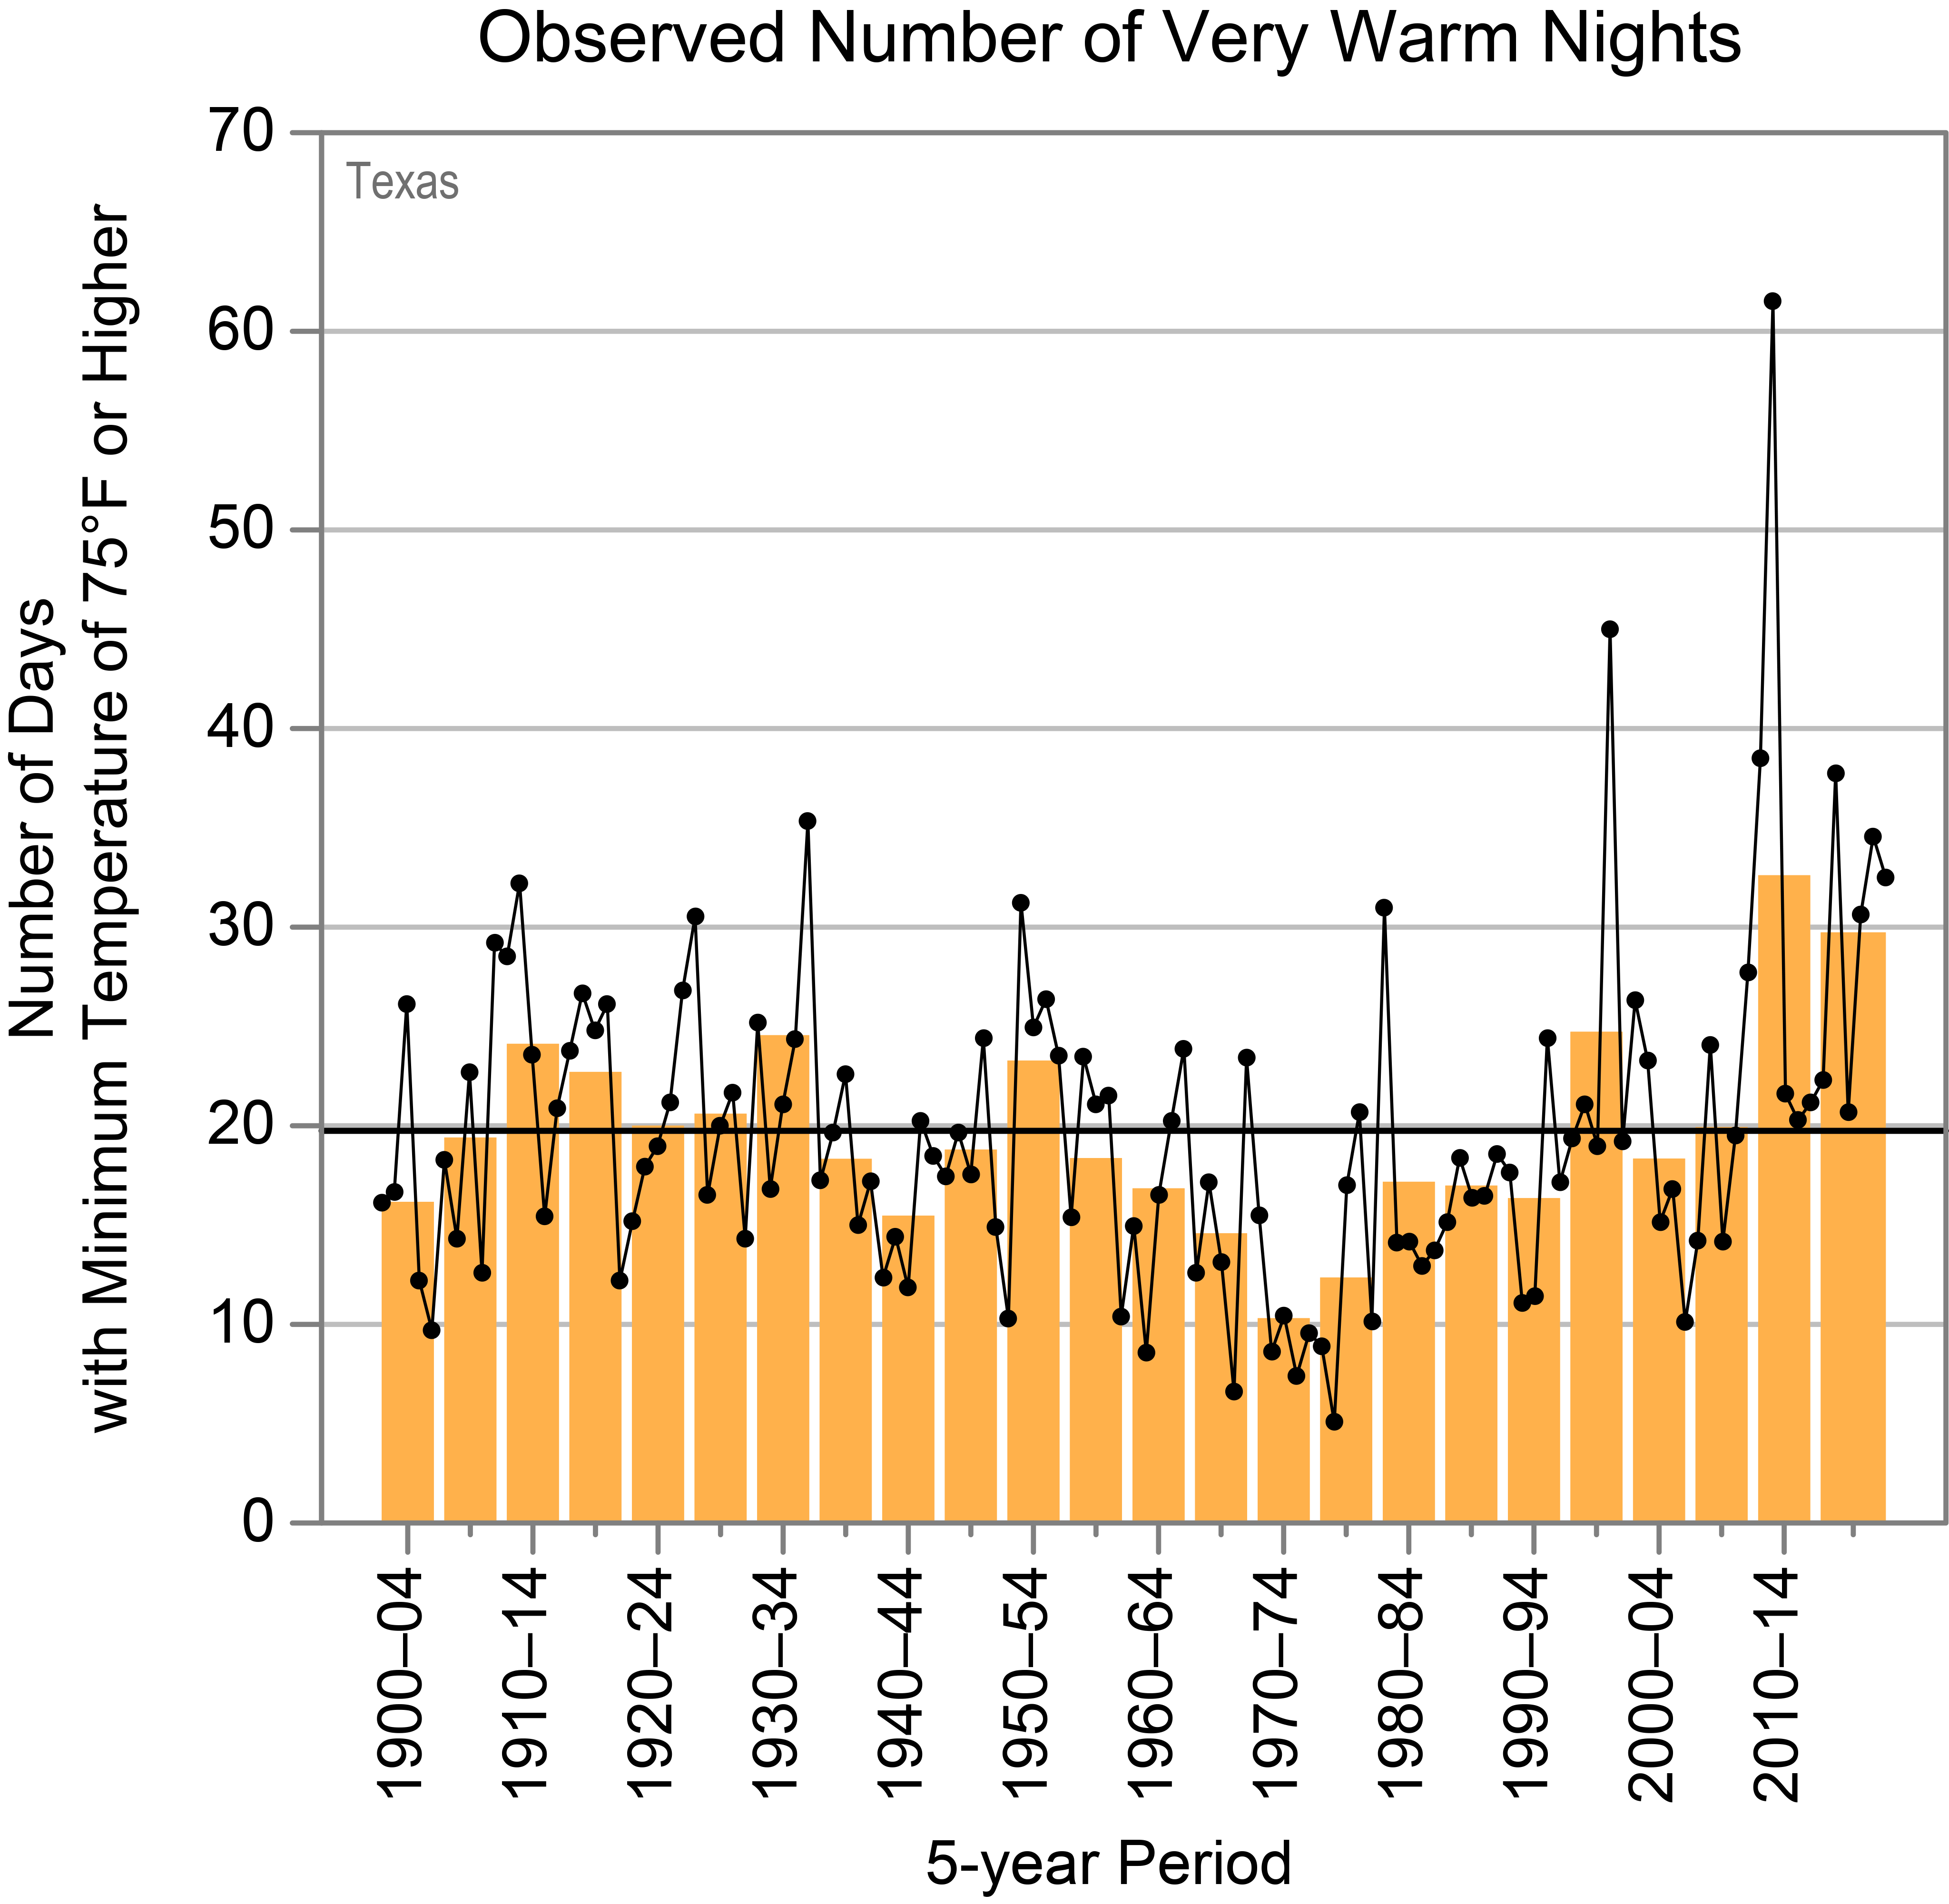
Temperatures in Texas have risen almost 1.5˚F since the beginning of the 20th century (Figure 1). While there is no overall trend in extremely hot days (Figure 2), the number of very warm nights was particularly high during the 2010s (Figure 3). The urban heat island effect increased these occurrences in city centers. The summer of 2011 was the warmest summer on record (since 1895) and broke the state record for highest average number of days with temperatures of 100°F or more. The Dallas-Fort Worth area endured 40 consecutive days with temperatures higher than 100˚F, which was the second-longest streak on record (1899–2020). The record dry conditions contributed to the higher temperatures. Daily minimum temperatures in January typically range from about 20°F in the northern Panhandle to about 50°F near the mouth of the Rio Grande River. The annual number of entire days below freezing was well above average in the 1970s and 1980s but has since been near the long-term average (Figure 4a).

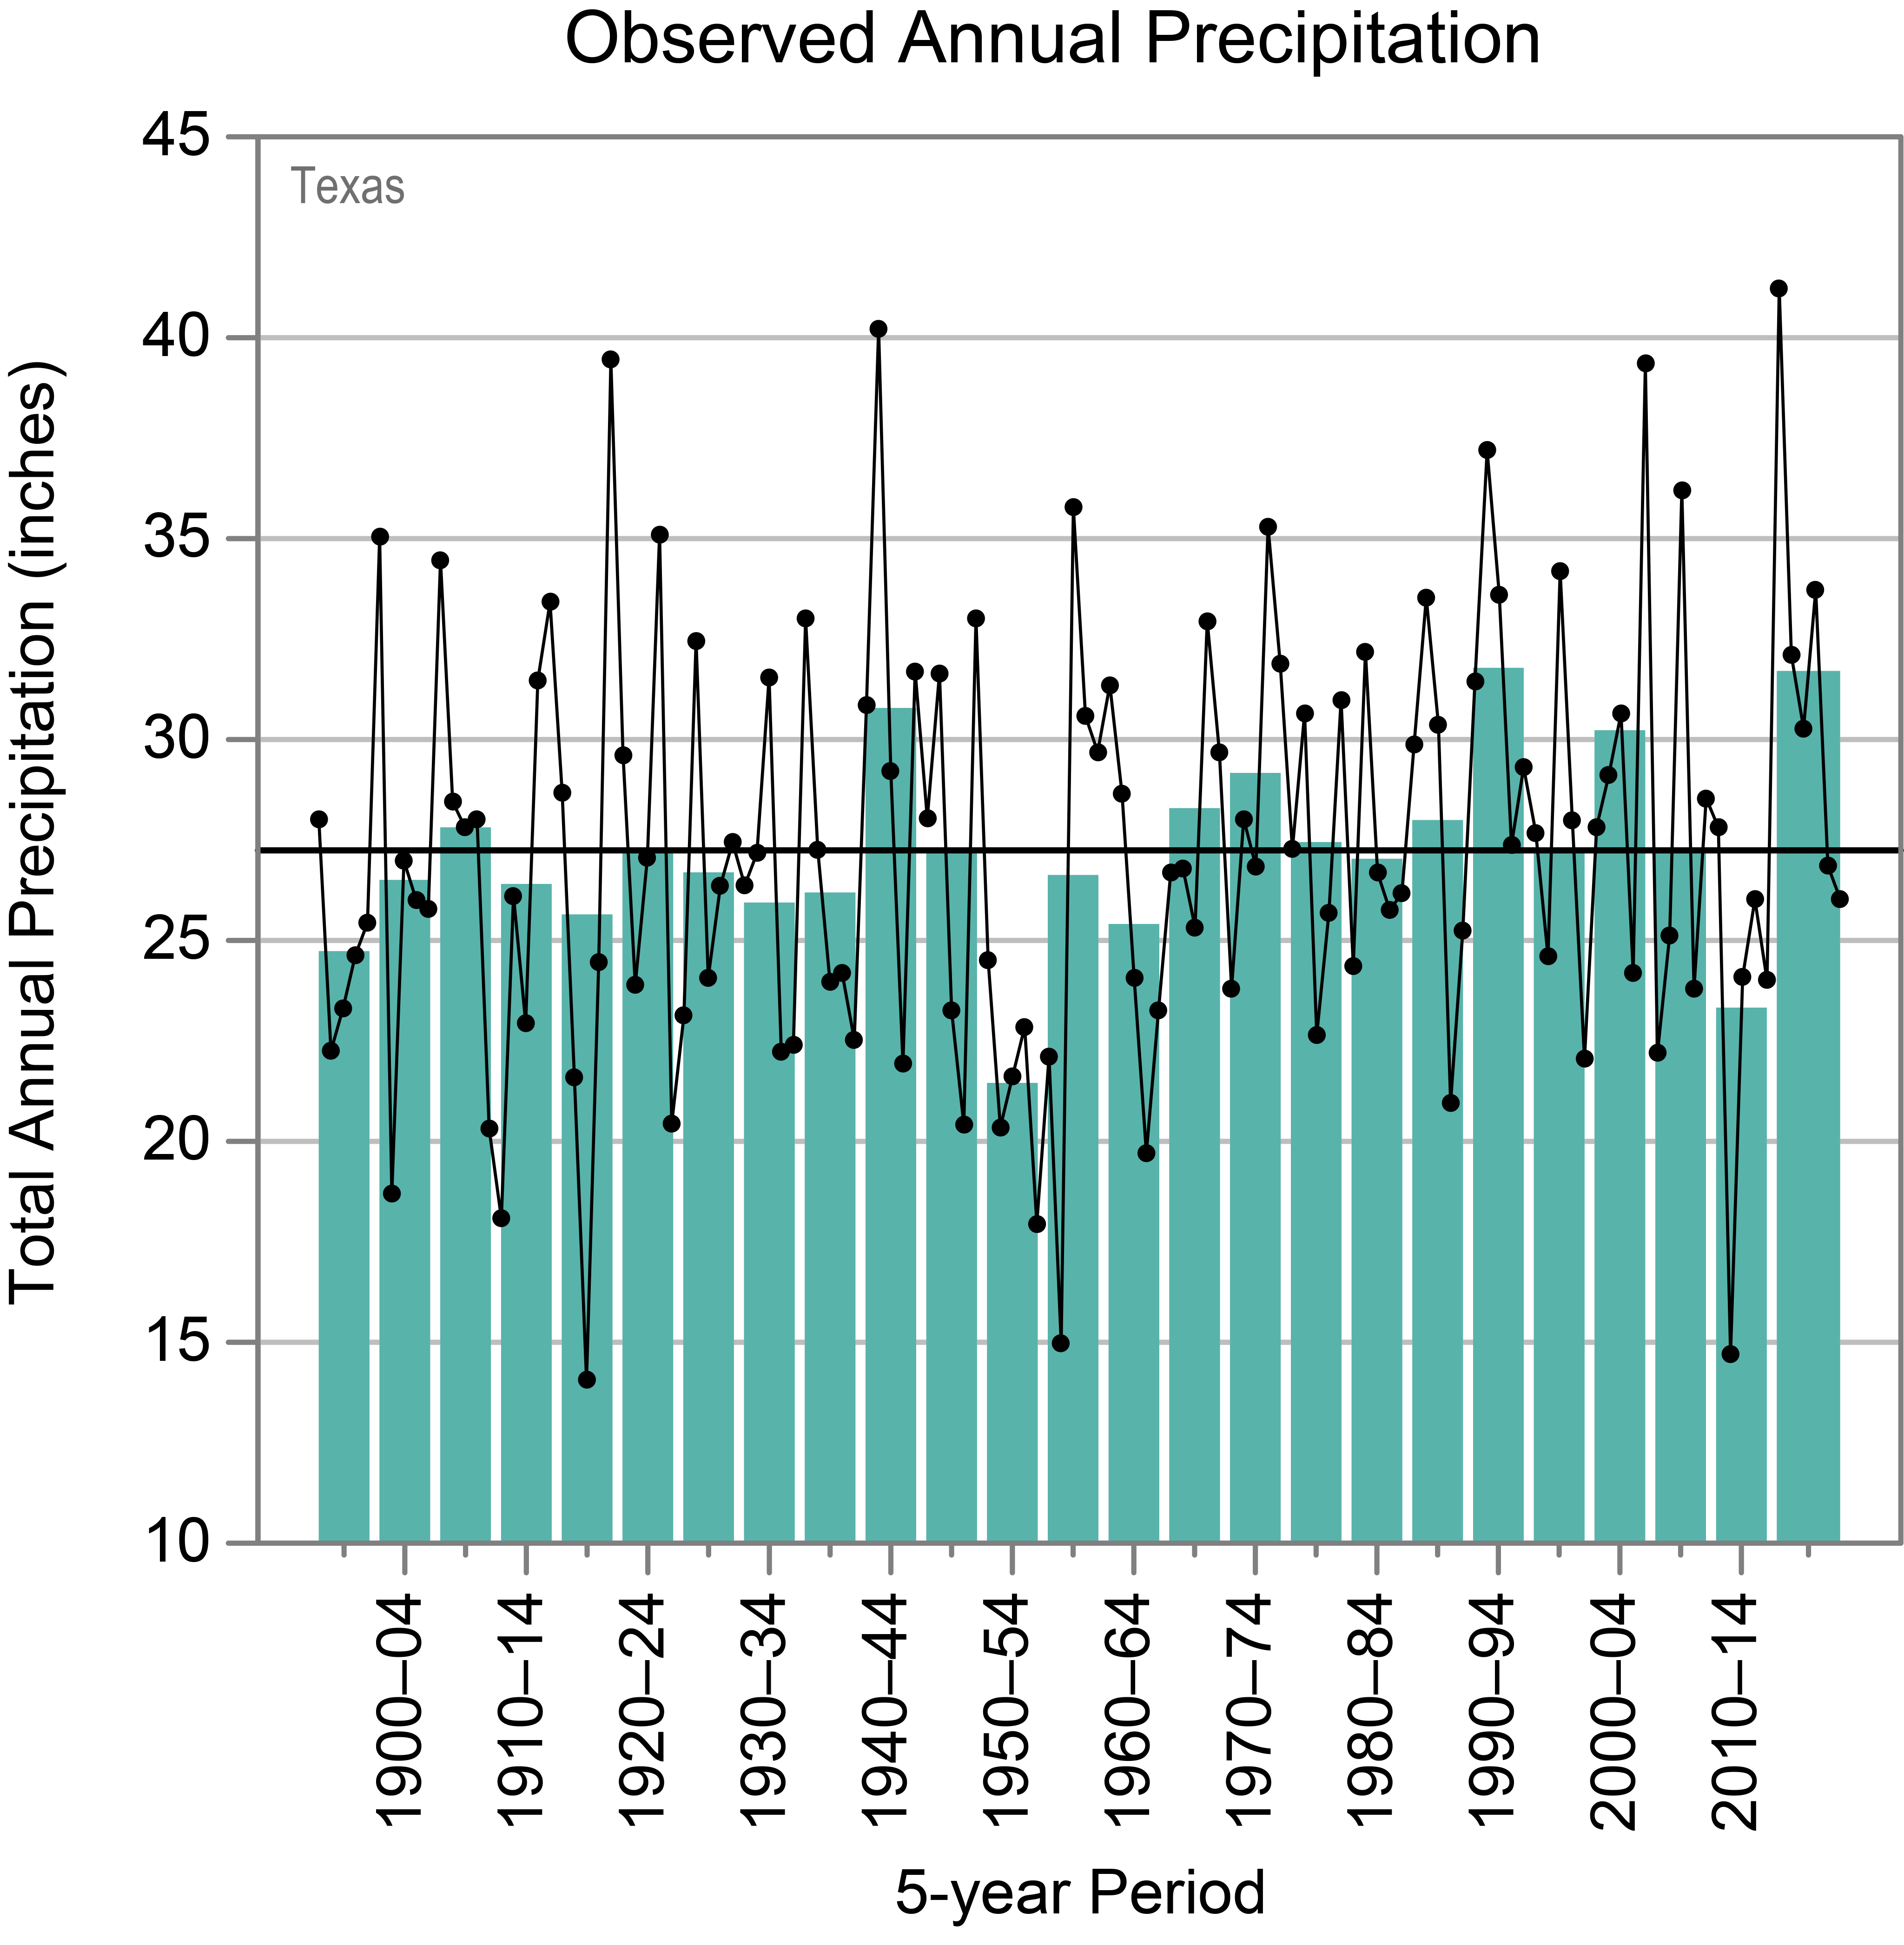
Precipitation is widely variable across Texas, with normal amounts ranging from less than 10 inches in the far west to more than 60 inches in the extreme southeast. Historically significant droughts occurred in the late 1910s, the early 1950s, and the early 2010s; the driest calendar years were 1917, 1956, and 2011 (Figure 4b). The driest consecutive 5 years was the 1952–1956 interval and the wettest was the 2015–2019 period. In the 1990s and early 2000s, the number of 3-inch extreme precipitation events was above average, and after the dry period of 2005–2014, they were well above average during the 2015–2020 period (Figure 4c). The five wettest months on record have all occurred since the year 2000, led by 9.1 inches in May 2015. Hurricane Harvey (2017) was the most destructive event in Texas history, mostly due to the unprecedented rainfall, which contributed to the second wettest month on record despite affecting only part of the state. After making landfall on August 25, Harvey slowed and was nearly stationary for several days near Houston. Rainfall exceeded 30 inches in many locations, and a few locations had more than 50 inches (Figure 5). Catastrophic flooding occurred across much of southeast Texas.

Texas is consistently ranked in the top 10 states affected by extreme events. In 2020, the state was hit by eleven of the nation’s billion-dollar disasters. The three most impactful events were drought, extreme heat, and wildfires. The warmest and the driest summer in the historical record helped fuel the worst wildfire season since statewide records began (approximately 1990), with nearly 4 million acres burned and almost $750 million in damages. Since the creation of the United States Drought Monitor Map in 2000, Texas has been completely drought-free for approximately 8% of the time (2000–2014), and at least half of the state has been under drought conditions for approximately 42% of the same period. Paleoclimatic records indicate that droughts as severe as the one in 2011 have occurred occasionally in the past 1000 years (Figure 6). Higher temperatures and drought conditions are likely to increase the severity, frequency, and extent of wildfires in the future, threatening significant harm to property, human health, and the livelihood of residents.

   
Observed Number of Extremely Hot Days
Graph of the observed annual number of extremely hot days for Texas from 1900 to 2020 as described in the caption. Y-axis values range from 0 to 70 days. Annual values show year-to-year variability and range from about 4 to 67 days. The value of about 67 in 2011 is more than 20 days higher than in any other year. Multiyear values also show variability and are below the long-term average of 20 days between 1900 and 1909 but are mostly near or above average between 1910 and 1964. Since 1965, multiyear values are all near or below average, with the exception of the 2010 to 2014 period. The 1990 to 1994 period has the lowest multiyear value, and the 1950 to 1954 period, which is well above average, has the highest.
Figure 2: Observed annual number of extremely hot days (maximum temperature of 100°F or higher) for Texas from 1900 to 2020. Dots show annual values. Bars show averages over 5-year periods (last bar is a 6-year average). The horizontal black line shows the long-term (entire period) average of 20 days. The number of extremely hot days in Texas was mostly above average between 1910 and 1960 and has been below average since the 1960–1964 period, with the exception of the 2010–2014 period. Sources: CISESS and NOAA NCEI. Data: GHCN-Daily from 24 long-term stations.
   
Observed Number of Very Warm Nights
Graph of the observed annual number of very warm nights for Texas from 1900 to 2020 as described in the caption. Y-axis values range from 0 to 70 nights. Annual values show year-to-year variability and range from about 5 to 62 nights. The year 2011 had about 62 nights and is the only year with more than 50 very warm nights. Multiyear values also show variability. They are mostly near the long-term average of 20 nights between 1900 and 1954, and all below average between 1995 and 1994. Since 1995, multiyear values are near or above average. The 2010 to 2014 and 2015 to 2020 periods are well above average and have the highest multiyear values. The 1970 to 1974 period, which is well below average, has the lowest multiyear value.
Figure 3: Observed annual number of very warm nights (minimum temperature of 75°F or higher) for Texas from 1900 to 2020. Dots show annual values. Bars show averages over 5-year periods (last bar is a 6-year average). The horizontal black line shows the long-term (entire period) average of 20 days. The 1970s saw a record low number of very warm nights. That number increased in the early 21st century, with the record highest number occurring in the 2010–2014 period. Sources: CISESS and NOAA NCEI. Data: GHCN-Daily from 24 long-term stations.

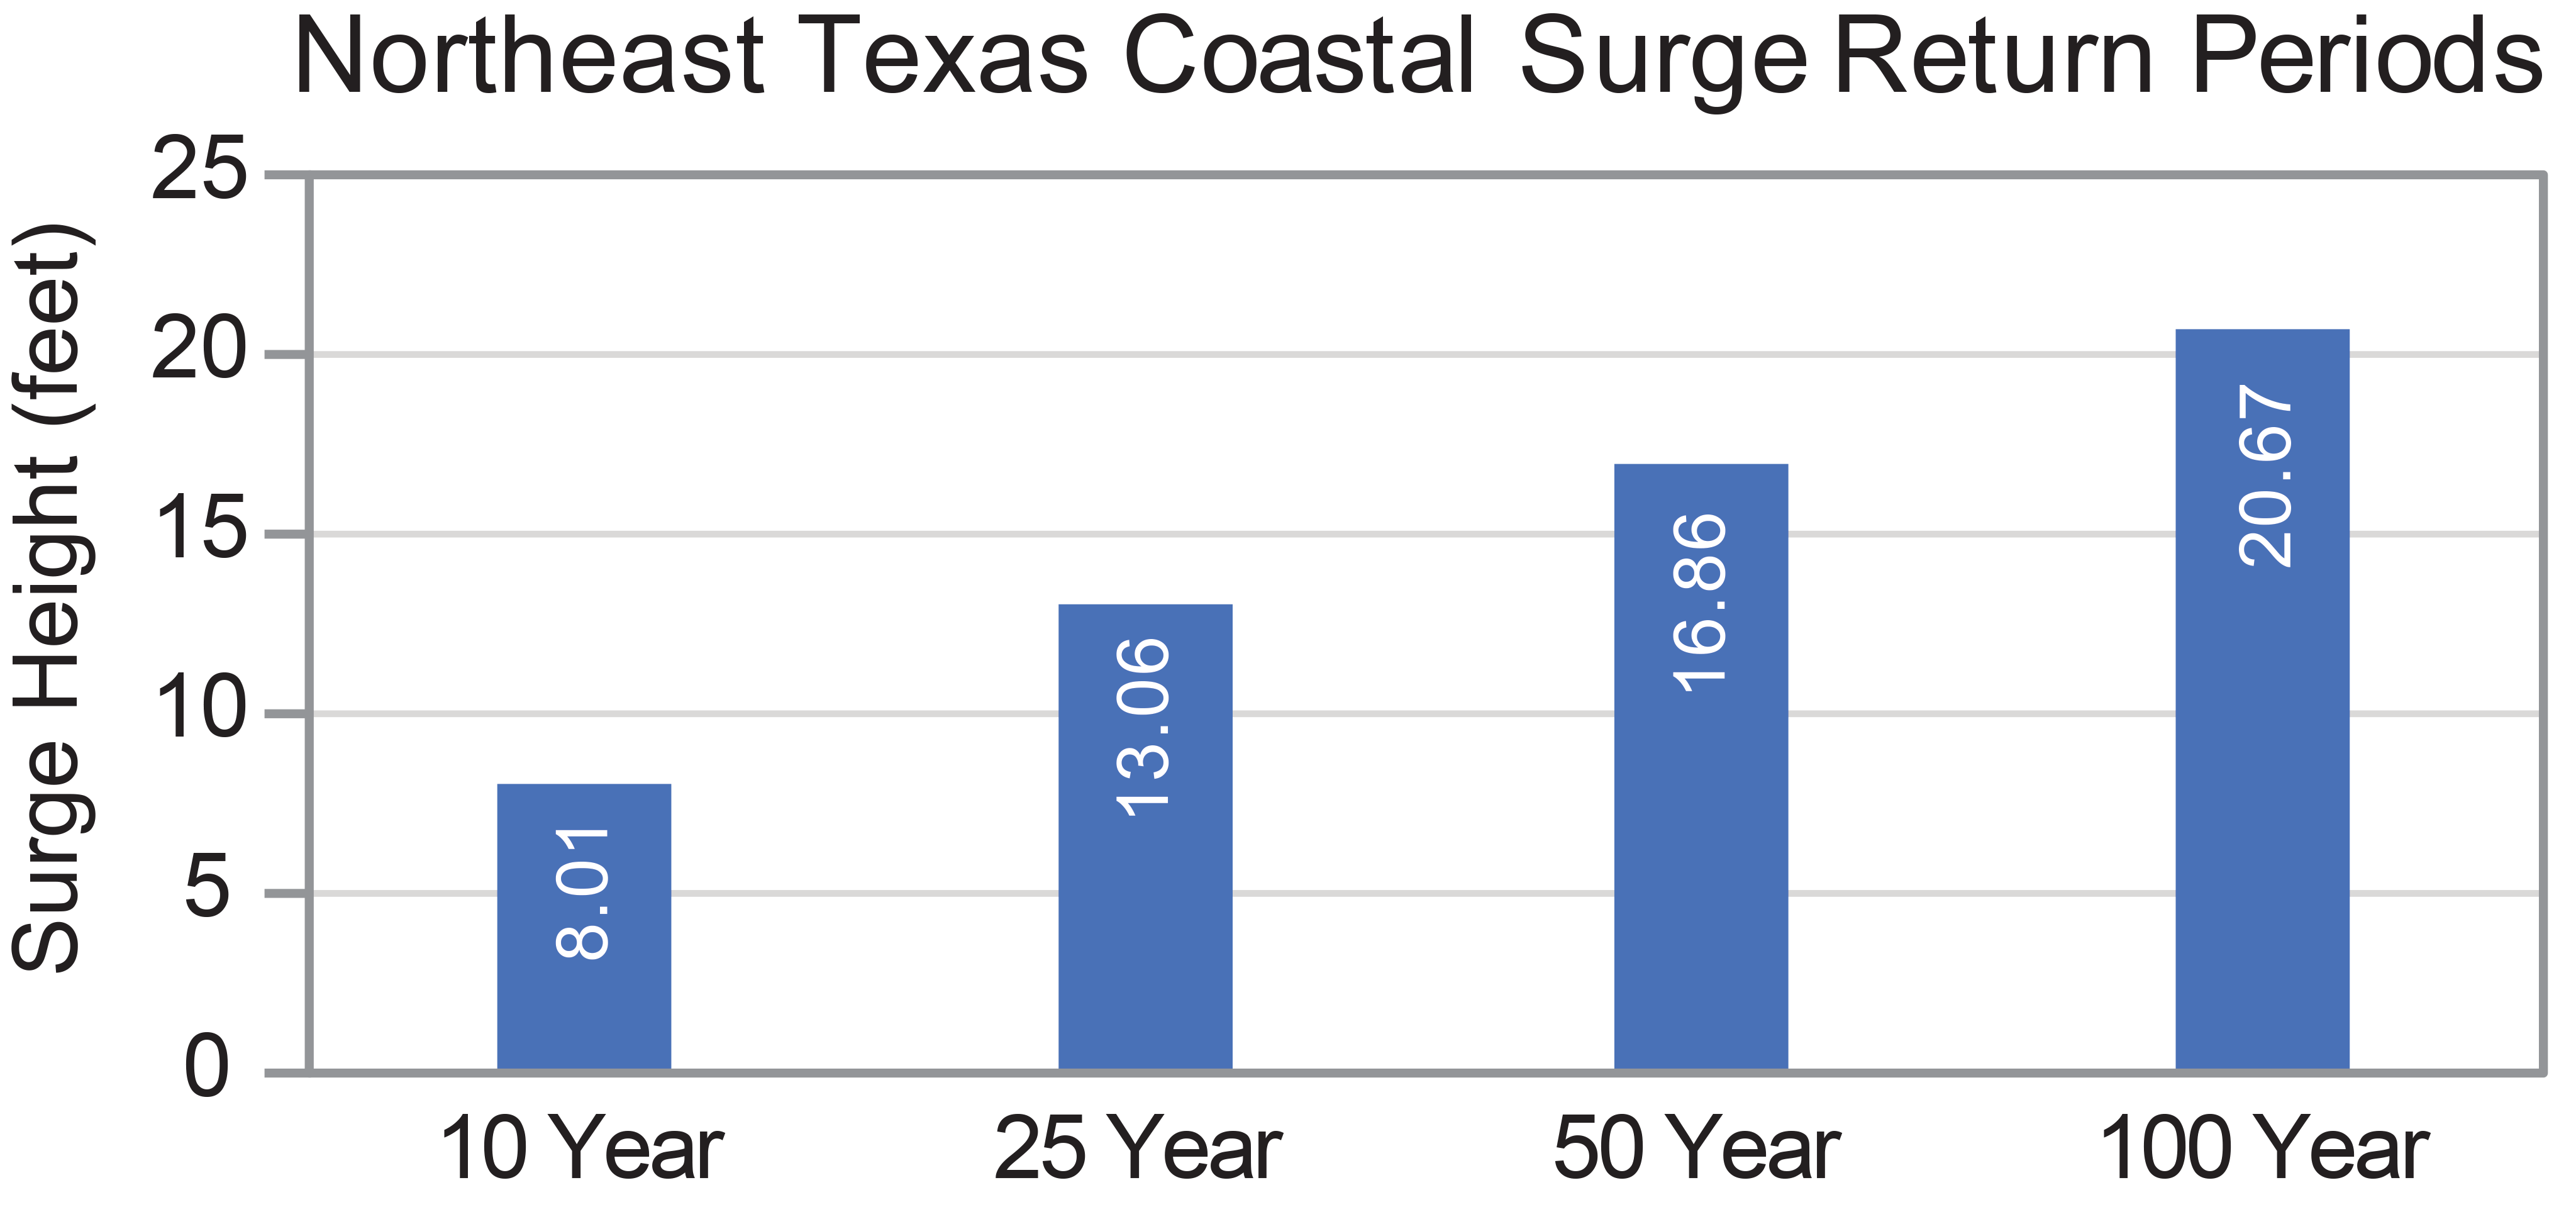
Over the period of 1900 to 2020, Texas endured more than 85 tropical storms and hurricanes (about 3 storms every 4 years); approximately half of them (46) were hurricanes (Figure 4d). Since 2000, Texas has experienced 19 named storms, including 8 destructive hurricanes, with Hurricane Harvey (Category 4), Hurricane Rita (Category 3), and Hurricane Ike (Category 2) causing the most significant damage. While Hurricane Rita caused the largest U.S. evacuation in history, Hurricane Harvey is the costliest hurricane in Texas history, with an estimated $136 billion in damages. Storm surges between 11 and 13 feet along the Texas coast typically have return periods of 25 years (Figure 7). Over the past 30 years (1991–2020), Texas has averaged 149 tornadoes and 4 tornado fatalities per year. Events can occur all year, though activity typically peaks between April and June.

Figure 4


a)

Observed Number of Entire Days Before Freezing
Graph of the observed annual number of days below freezing for Texas from 1900 to 2020 as described in the caption. Y-axis values range from 0 to 10 days. Annual values show year-to-year variability and range from 0.4 to 9.3 days. Multiyear values also show variability and are all near or below the long-term average of 2.4 days between 1900 and 1944 but are mostly near or above average between 1945 and 1989. Since 1990, multiyear values are mostly below average. The 1935 to 1939 and 1990 to 1994 periods have the lowest multiyear values, and the 1985 to 1989 period has the highest.
   

b)

Observed Annual Precipitation
Graph of the observed total annual precipitation for Texas from 1895 to 2020 as described in the caption. Y-axis values range from 10 to 45 inches. Annual values show year-to-year variability and range from about 14 to 41 inches. Prior to 1965, multiyear values are mostly near or below the long-term average of 27.2 inches. Since 1965, multiyear values are all near or above average, with the exception of the 2010 to 2014 period. The 1950 to 1954 period, which is well below average has the lowest multiyear value, and the 1990 to 1994 and 2015 to 2020 periods have the highest.
   

c)

Observed Number of 3-Inch Extreme Precipitation Events
Graph of the observed annual number of 3-inch extreme precipitation events for Texas from 1900 to 2020 as described in the caption. Annual values show year-to-year variability and range from 0.2 to 2.3 days. Multiyear values also show variability and are mostly near or below average between 1900 and 1989 but are mostly above average since 1990. The 1930 to 1934 period has the lowest multiyear value, and the 2015 and 2020 period has the highest.
   

d)

Total Hurricane Events in Texas
Graph of the total number of hurricane events for Texas from 1900 to 2020 as described in the caption. Y-axis values range from 0 to 6 events. Multiyear values show variability. Zero events occurred during the multiyear periods of 1950 to 1954, 1975 to 1979, 1990 to 1994, and 2010 to 2014. The greatest number of events (5) occurred during the 1940 to 1944 period. The 1915 to 1919, 1930 to 1934, and 2005 to 2009 periods had 4 events each.
Figure 4: Observed (a) annual number of entire days below freezing (maximum temperature of 32°F or lower), (b) total annual precipitation, (c) annual number of 3-inch extreme precipitation events (days with precipitation of 3 inches or more), and (d) total number of hurricane events (wind speeds reaching hurricane strength somewhere in the state) for Texas from (a, c, d) 1900 to 2020 and (b) 1895 to 2020. In Figures 4a, 4b, and 4c, bars show averages over 5-year periods (last bar is a 6-year average), dots show annual values, and the horizontal black lines show the long-term (entire period) averages: (a) 2.4 days, (b) 27.2 inches, (c) 0.8 days. In Figure 4d, bars show totals over 5-year periods (last bar is a 6-year total). The number of entire days below freezing was above average in the 1970s and 1980s, but since then it has been mostly below the long-term average. Annual precipitation has varied year to year but was well above average during the 2015–2020 period. The number of extreme precipitation events was above average during the 1990s and early 2000s and again in the 2015–2020 period. A typical reporting station experiences about one 3-inch precipitation event per year. There is no long-term trend in the number of hurricanes. Sources: CISESS and NOAA NCEI. Data: (a) GHCN-Daily from 24 long-term stations; (b) nClimDiv; (c) GHCN-Daily from 47 long-term stations.

Under both higher and lower emissions pathways, historically unprecedented warming is projected by the end of this century (Figure 1). However, a large range of temperature increases is projected under both pathways, and under the lower pathway, a few projections are only slightly warmer than historical records. Increases in the number of extremely hot days and decreases in the number of extremely cold days are projected to accompany the overall warming. By 2055, an estimated increase of 20–30 days with temperatures higher than 95°F is projected under one pathway, with the greatest increase in southwestern Texas.

Future changes in annual average precipitation are generally projected to be small (Figure 8), but an increase in extreme precipitation is likely. Furthermore, even if average precipitation does not change, higher temperatures will increase the rate of soil moisture loss, likely leading to more intense naturally occurring droughts. Longer dry spells are also projected.

   
Total Rainfall Amounts August 25–31, 2017
Map of southeastern Texas showing cumulative, seven-day rainfall totals from Hurricane Harvey during August 24 to 31, 2017, as described in the caption. A legend showing graded colors and the associated totals (in both millimeters and inches) appears beneath the map. Areas in the west and north experienced less rainfall, with totals ranging from 0 to 2 inches (0 to 50 millimeters). The areas closest to the coast and the southernmost portion of the Louisiana border experienced the most, with some locations seeing 43 to 51 inches (1100 to 1300 millimeters).
Figure 5: Rainfall totals in southeast Texas from Hurricane Harvey for August 24–31, 2017. Large areas received more than 30 inches of rainfall, with more than 50 inches in a few locations. The Houston metro area experienced massive flooding, displacing tens of thousands of residents and damaging or destroying more than 100,000 homes and businesses. Source: Martinaitis et al. 2021, Figure 12a. © American Meteorological Society. Used with permission.
   
Texas Palmer Drought Severity Index
Line graph of the Texas Palmer Drought Severity Index for the years 1000 to 2020 as described in the caption. Y-axis values are divided into dry and wet categories, ranging from 0 to minus 6 (dry) and 0 to positive 6 (wet). Annual values range from less than minus 4 to more than positive 4. Values for most years fall between about minus 3 and positive 3, but values reaching minus 4 and positive 4 are common. The 20-year moving average shows variability. The average was near 0 for the first half of the 20th century, decreased to about minus 1 around the 1950s, and increased to almost positive 1 by the end of the century. There has been a small downward trend in recent years.
Figure 6: Time series of the Palmer Drought Severity Index for Texas from the year 1000 to 2020. Values for 1895–2020 (red) are based on measured temperature and precipitation. Values prior to 1895 (blue) are estimated from indirect measures such as tree rings. The variances between the two segments may not be homogeneous because of these data and methodological differences. The fluctuating black line is a running 20-year average. Periods of drought are common in Texas; the most severe droughts since 1895 were those in 1956 and 2011. Prior to 1895, droughts of the 1956 and 2011 severity occurred occasionally. Sources: CISESS and NOAA NCEI. Data: nClimDiv and NADAv2.
   
Northeast Texas Coastal Surge Return Periods
Graph of storm surge heights on the northeast coast of Texas for four return periods as described in the caption. Y-axis values range from 0 to 25 feet. Storm surge heights at 10, 25, 50, and 100-year intervals are 8.01, 13.06, 16.86, and 20.67 feet, respectively.
Figure 7: Storm surge heights occurring at selected average return intervals (10, 25, 50, and 100 years) along the northeast coast of Texas. Sources: CISESS and NOAA NCEI. Data: Needham et al. 2012.

Increased drought severity and increased human demand for surface water will cause changes in streamflow, with extended reductions of freshwater inflow to Texas bays and estuaries. These changes in streamflow will cause temporary or permanent changes to bay salinity and oxygen content, which will have potentially major impacts on bay and estuary ecosystems, such as negatively affecting organism growth, reproduction, and survival.

Future changes in the frequency and severity of tornadoes, hail, and severe thunderstorms are uncertain. However, hurricane intensity and rainfall are projected to increase for Texas as the climate warms.

Since 1900, global average sea level has risen by about 7–8 inches. It is projected to rise another 1–8 feet, with a likely range of 1–4 feet, by 2100 as a result of both past and future emissions from human activities (Figure 9). Sea level rise has caused an increase in tidal floods associated with nuisance-level impacts. Nuisance floods are events in which water levels exceed the local threshold (set by NOAA’s National Weather Service) for minor impacts. These events can damage infrastructure, cause road closures, and overwhelm storm drains. As sea level has risen along the Texas coastline, the number of tidal flood days has also increased, with the greatest number occurring in 2020 (Figure 10). Future sea level rise will increase the frequency of nuisance flooding and the potential for greater damage from storm surge.

   
Projected Change in Annual Precipitation
Map of the contiguous United States showing the projected changes in total annual precipitation by the middle of this century as described in the caption. Values range from less than minus 20 to greater than positive 15 percent. Annual precipitation is projected to increase across the northern, central, and southeastern United States. Statistically significant increases are projected for central Wyoming and northern Colorado, the Midwest, Northeast, and Mid-Atlantic. The greatest decreases are projected for the Southwest United States. The majority of Texas is projected to see a decrease of 0 to 5 percent, with the exception of a small band along the southwestern border and the Gulf region, with projected decreases of 5 to 10 percent.
Figure 8: Projected changes in total annual precipitation (%) for the middle of the 21st century compared to the late 20th century under a higher emissions pathway. Hatching represents areas where the majority of climate models indicate a statistically significant change. Texas is part of a large area in the southwestern and central United States with projected decreases in annual precipitation, but most models do not indicate that these changes are statistically significant. Sources: CISESS and NEMAC. Data: CMIP5.
   
Observed and Projected Change in Global Sea Level
Line graph of observed and projected change in global mean sea level from 1800 to 2100 as described in the caption. Y-axis values are labeled from 0 to 8 feet. The historical line shows that observed sea level from 1800 to 1900 was relatively constant but increased by 7 to 8 inches by 2015. Six lines of increasing steepness extend from the historical line, representing the six projected sea level rise scenarios from Low (a half foot) to Extreme (8 feet). Two box and whisker plots to the right of the x-axis show the likely and possible ranges of sea level rise under lower (left) and higher (right) emissions scenarios.
Figure 9: Global mean sea level (GMSL) change from 1800 to 2100. Projections include the six U.S. Interagency Sea Level Rise Task Force GMSL scenarios (Low, navy blue; Intermediate-Low, royal blue; Intermediate, cyan; Intermediate-High, green; High, orange; and Extreme, red curves) relative to historical geological, tide gauge, and satellite altimeter GMSL reconstructions from 1800–2015 (black and magenta lines) and the very likely ranges in 2100 under both lower and higher emissions futures (teal and dark red boxes). Global sea level rise projections range from 1 to 8 feet by 2100, with a likely range of 1 to 4 feet. Source: adapted from Sweet et al. 2017.
   
Observed and Projected Annual Number of Tidal Floods for Port Isabel, TX
Graph of the observed and projected annual number of tidal flood days at Port Isabel, Texas, from 1920 to 2100 (top panel) as described in the caption. The bottom panel is a magnified view of the observed data. In the top panel, y-axis values range from 0 to 400 days, with a dashed line indicating the maximum possible number of tidal flood days per year (365). In the bottom panel, y-axis values range from 0 to 15 days, and observed values range from 0 to 12 days. Following the first recorded event in 1961, tidal flooding was sporadic until 2016, often with gaps of 1 to 6 years between events and annual values all below 4 days. Starting in 2017, tidal flood days have occurred every year, with a record high of 12 days in 2020. Port Isabel is projected to experience about 55 to 194 days by 2050 under the Intermediate-Low and Intermediate scenarios, respectively, and about 346 to 365 days by 2100.
Figure 10: Number of tidal flood days per year at Port Isabel, TX, for the observed record (1944–2020; orange bars) and projections for 2 NOAA (2017) sea level rise scenarios (2021–2100): Intermediate (dark blue bars) and Intermediate-Low (light blue bars). The NOAA (2017) scenarios are based on local projections of the GMSL scenarios shown in Figure 9. Sea level rise has caused a gradual increase in tidal floods associated with nuisance-level impacts. The greatest number of tidal flood days (all days exceeding the nuisance-level threshold) occurred in 2020 at Port Isabel. Projected increases are large even under the Intermediate-Low scenario. Under the Intermediate scenario, tidal flooding is projected to occur nearly every day of the year by the end of the century. Additional information on tidal flooding observations and scenarios is available at https://statesummaries.ncics.org/technicaldetails. Sources: CISESS and NOAA NOS.

Details on observations and projections are available on the Technical Details and Additional Information page.

Lead Authors
Jennifer Runkle, Cooperative Institute for Satellite Earth System Studies (CISESS)
Kenneth E. Kunkel, Cooperative Institute for Satellite Earth System Studies (CISESS)
Contributing Authors
John Nielsen-Gammon, Office of the State Climatologist, Texas A&M University
Rebekah Frankson, Cooperative Institute for Satellite Earth System Studies (CISESS)
Sarah M. Champion, Cooperative Institute for Satellite Earth System Studies (CISESS)
Brooke C. Stewart, Cooperative Institute for Satellite Earth System Studies (CISESS)
Luigi Romolo, Minnesota State Climatology Office, Minnesota Department of Natural Resources
William Sweet, NOAA National Ocean Service
Recommended Citation
Runkle, J., K.E. Kunkel, J. Nielson-Gammon, R. Frankson, S.M. Champion, B.C. Stewart, L. Romolo, and W. Sweet, 2022: Texas State Climate Summary 2022. NOAA Technical Report NESDIS 150-TX. NOAA/NESDIS, Silver Spring, MD, 5 pp.

RESOURCES

  • Amico, C., D. DeBelius, T. Henry, and M. Stiles, n.d.: Dried Out: Confronting the Texas Drought. National Public Radio, StateImpact Texas. https://stateimpact.npr.org/texas/drought/
  • DiLiberto, T., 2015: Flood disaster in Texas and Oklahoma. Climate.gov News & Features, June 2, 2015. https://www.climate.gov/news-features/event-tracker/flood-disaster-texas-and-oklahoma
  • Edwards, R., n.d.: The Online Tornado FAQ. National Oceanic and Atmospheric Administration, Storm Prediction Center, Norman, OK, last modified 19 March 2021. https://www.spc.noaa.gov/faq/tornado/
  • EPA, 2016: What Climate Change Means for Texas. EPA 430-F-16-045. U.S. Environmental Protection Agency, Washington, DC, 2 pp. https://www.epa.gov/sites/production/files/2016-09/documents/climate-change-tx.pdf
  • Freedman, A., A. Kenward, and M. Lemonick, 2011: Texas tops 10 states ravaged by extreme weather in 2011. Climate Central News, December 20, 2011. Climate Central, Princeton, NJ. https://www.climatecentral.org/news/texas-tops-10-states-ravaged-by-extreme-weather-2011/
  • Goff, J.A., L. Lugrin, S.P. Gulick, K. Thirumalai, and Y. Okumura, 2016: Oyster reef die-offs in stratigraphic record of Corpus Christi Bay, Texas, possibly caused by drought-driven extreme salinity changes. The Holocene, 26 (4), 511–519. http://dx.doi.org/10.1177/0959683615612587
  • Hayhoe, K., D.J. Wuebbles, D.R. Easterling, D.W. Fahey, S. Doherty, J. Kossin, W. Sweet, R. Vose, and M. Wehner, 2018: Our changing climate. In: Impacts, Risks, and Adaptation in the United States: Fourth National Climate Assessment, Volume II. Reidmiller, D.R., C.W. Avery, D.R. Easterling, K.E. Kunkel, K.L.M. Lewis, T.K. Maycock, and B.C. Stewart, Eds. U.S. Global Change Research Program, Washington, DC, 72–144. https://nca2018.globalchange.gov/chapter/2/
  • Hoerling, M., A. Kumar, R. Dole, J.W. Nielsen-Gammon, J. Eischeid, J. Perlwitz, X.-W. Quan, T. Zhang, P. Pegion, and M. Chen, 2013: Anatomy of an extreme event. Journal of Climate, 26 (9), 2811–2832. http://dx.doi.org/10.1175/JCLI-D-12-00270.1
  • Kim, H.-C., S. Son, P. Montagna, B. Spiering, and J. Nam, 2014: Linkage between freshwater inflow and primary productivity in Texas estuaries: Downscaling effects of climate variability. Journal of Coastal Research, 68 (sp1), 65–73. http://dx.doi.org/10.2112/SI68-009.1
  • Kunkel, K.E., L.E. Stevens, S.E. Stevens, L. Sun, E. Janssen, D. Wuebbles, M.C. Kruk, D.P. Thomas, M.D. Shulski, N.A. Umphlett, K.G. Hubbard, K. Robbins, L. Romolo, A. Akyuz, T.B. Pathak, T.R. Bergantino, and J.G. Dobson, 2013: Regional Climate Trends and Scenarios for the U.S. National Climate Assessment Part 4. Climate of the U.S. Great Plains. NOAA Technical Report NESDIS 142-4. National Oceanic and Atmospheric Administration, National Environmental Satellite, Data, and Information Service, Silver Spring, MD, 91 pp. https://nesdis-prod.s3.amazonaws.com/migrated/NOAA_NESDIS_Tech_Report_142-4-Climate_of_the_US_Great_Plains.pdf
  • Martinaitis, S.M., S.B. Cocks, A.P. Osborne, M.J. Simpson, L. Tang, J. Zhang, and K.W. Howard, 2021: The historic rainfalls of Hurricanes Harvey and Florence: A perspective from the Multi-Radar Multi-Sensor system. Journal of Hydrometeorology, 22 (3), 721–738. http://dx.doi.org/10.1175/JHM-D-20-0199.1
  • Melillo, J.M., T.C. Richmond, and G.W. Yohe, 2014: Climate Change Impacts in the United States: The Third National Climate Assessment. Washington, DC, 841 pp. http://dx.doi.org/10.7930/J0Z31WJ2
  • NDMC, n.d.: U.S. Drought Monitor, Data Tables. National Drought Mitigation Center, Lincoln, NE. https://droughtmonitor.unl.edu/DmData/DataTables.aspx
  • Needham, H.F. and B.D. Keim, 2012: A storm surge database for the US Gulf Coast. International Journal of Climatology, 32 (14), 2108–2123. http://dx.doi.org/10.1002/joc.2425
  • Needham, H.F., B.D. Keim, D. Sathiaraj, and M. Shafer, 2012: Storm surge return periods for the United States Gulf Coast. In: World Environmental and Water Resources Congress 2021. Albuquerque, NM, May 20–24, 2012. American Society of Civil Engineers, 2422–2463. http://dx.doi.org/10.1061/9780784412312.245
  • Nielsen-Gammon, J.W., 2011: The 2011 Texas Drought: A Briefing Packet for the Texas Legislature. Texas A&M University, College of Geosciences, Office of the State Climatologist, College Station, TX, 43 pp. https://hdl.handle.net/1969.1/158245
  • Nielsen-Gammon, J.W., 2011: The changing climate of Texas. In: The Impact of Global Warming on Texas. Schmandt, J., G.R. North, and J. Clarkson, Eds. University of Texas Press, 39–68.
  • NOAA HRD, 2014: Continental United States Hurricane Impacts/Landfalls 1851–2019. National Oceanic and Atmospheric Administration, Hurricane Research Division, Atlantic Oceanographic and Meteorological Laboratory, Miami, FL, last modified June 2020. http://www.aoml.noaa.gov/hrd/hurdat/All_U.S._Hurricanes.html
  • NOAA NCEI, n.d.: Drought Variability [Data Access: Palmer Drought Index Studies: North American Drought Atlas (NADA) (Version 2a)]. National Oceanic and Atmospheric Administration, National Centers for Environmental Information. https://www.ncei.noaa.gov/products/paleoclimatology/drought-variability
  • NOAA NCEI, n.d.: State Climate Extremes Committee (SCEC): Records. National Oceanic and Atmospheric Administration, National Centers for Environmental Information, Asheville, NC. http://www.ncdc.noaa.gov/extremes/scec/records
  • NOAA NHC, n.d.: NHC Data Archive. National Oceanic and Atmospheric Administration, National Hurricane Center, Miami, FL. http://www.nhc.noaa.gov/data/
  • NOAA NOS, n.d.: National Ocean Service Education: Dissolved Oxygen. National Oceanic and Atmospheric Administration, National Ocean Service, Silver Spring, MD, last modified March 25, 2008. https://web.archive.org/web/20160303183620/http://oceanservice.noaa.gov/education/kits/estuaries/media/supp_estuar10d_disolvedox.html
  • NOAA NOS, n.d.: National Ocean Service Education: Salinity. National Oceanic and Atmospheric Administration, National Ocean Service, Silver Spring, MD, last modified March 25, 2008. https://web.archive.org/web/20160419085030/http://oceanservice.noaa.gov/education/kits/estuaries/media/supp_estuar10c_salinity.html
  • NOAA NWS, n.d.: Storm Prediction Center WCM Page. National Oceanic and Atmospheric Administration, National Weather Service, Storm Prediction Center, Norman, OK. https://www.spc.noaa.gov/wcm/
  • NOAA NWS, n.d.: Weather Event Summary: 2015 Memorial Day Weekend Flooding 23–24 May 2015. National Oceanic and Atmospheric Administration, National Weather Service, Austin/San Antonio Weather Forecast Office, Austin/San Antonio, TX, 32 pp. https://www.weather.gov/media/ewx/wxevents/ewx-20150524.pdf
  • NOAA RCCs ACIS, n.d.: Gridded NCEI Normals Mapper [Texas]. National Oceanic and Atmospheric Administration Regional Climate Centers, Applied Climate Information System. https://ncei-normals-mapper.rcc-acis.org/
  • Parris, A., P. Bromirski, V. Burkett, D. Cayan, M. Culver, J. Hall, R. Horton, K. Knuuti, R. Moss, J. Obeysekera, A. Sallenger, and J. Weiss, 2012: Global Sea Level Rise Scenarios for the United States National Climate Assessment. NOAA Technical Report OAR CPO-1. National Oceanic and Atmospheric Administration, Office of Oceanic and Atmospheric Research, Climate Program Office, Silver Spring, MD, 33 pp. https://repository.library.noaa.gov/view/noaa/11124
  • Roth, D., n.d.: Texas Hurricane History. National Oceanic and Atmospheric Administration, National Weather Service, Camp Springs, MD, 83 pp. https://www.wpc.ncep.noaa.gov/research/txhur.pdf
  • Sweet, W., G. Dusek, J. Obeysekera, and J. Marra, 2018: Patterns and Projections of High Tide Flooding Along the U.S. Coastline Using a Common Impact Threshold. NOAA Technical Report NOS CO-OPS 086. National Oceanic and Atmospheric Administration, National Ocean Service, Center for Operational Oceanographic Products and Services, Silver Spring, MD, 56 pp. https://tidesandcurrents.noaa.gov/publications/techrpt86_PaP_of_HTFlooding.pdf
  • Sweet, W., S. Simon, G. Dusek, D. Marcy, W. Brooks, M. Pendleton, and J. Marra, 2021: 2021 State of High Tide Flooding and Annual Outlook. NOAA High Tide Flooding Report. National Oceanic and Atmospheric Administration, National Ocean Service, Center for Operational Oceanographic Products and Services, Silver Spring, MD, 28 pp. https://tidesandcurrents.noaa.gov/publications/2021_State_of_High_Tide_Flooding_and_Annual_Outlook_Final.pdf
  • Sweet, W.V., R.E. Kopp, C.P. Weaver, J. Obeysekera, R.M. Horton, E.R. Thieler, and C. Zervas, 2017: Global and Regional Sea Level Rise Scenarios for the United States. NOAA Technical Report NOS CO-OPS 083. National Oceanic and Atmospheric Administration, National Ocean Service, Center for Operational Oceanographic Products and Services, Silver Spring, MD, 75 pp. https://tidesandcurrents.noaa.gov/publications/techrpt83_Global_and_Regional_SLR_Scenarios_for_the_US_final.pdf
  • TX OSC, n.d.: Drought Monitor. Texas Office of the State Climatologist, Texas A&M University, College Station, TX. https://web.archive.org/web/20150315002415/http://atmo.tamu.edu/osc/drought/
  • TX OSC, n.d.: FAQ: Climate Change. Texas Office of the State Climatologist, Texas A&M University, College Station, TX. https://web.archive.org/web/20160309203953/http://climatexas.tamu.edu/index.php/weather-faqs
  • Vose, R.S., D.R. Easterling, K.E. Kunkel, A.N. LeGrande, and M.F. Wehner, 2017: Temperature changes in the United States. In: Climate Science Special Report: Fourth National Climate Assessment, Volume I. Wuebbles, D.J., D.W. Fahey, K.A. Hibbard, D.J. Dokken, B.C. Stewart, and T.K. Maycock, Eds. U.S. Global Change Research Program, Washington, DC, 185–206. http://doi.org/10.7930/J0N29V45

Title

NOAA logo   CISESS

This website contains copyrighted images.

NCICS Department of Commerce logo